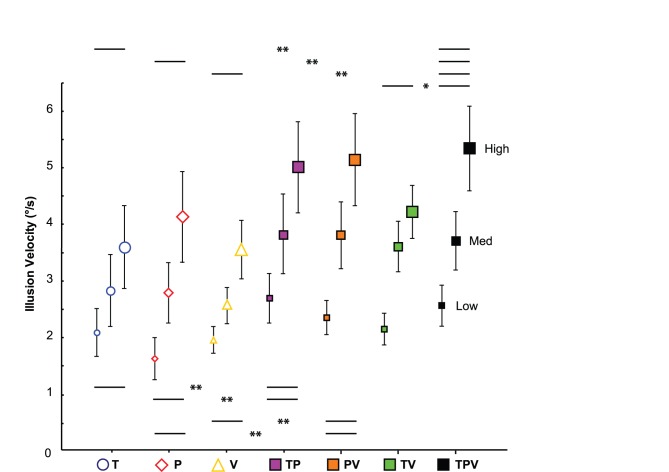
Figure 4. Comparison between the mean illusion velocities (± SEM) induced by unimodal, bimodal and trimodal stimulation applied at Low, Medium or High stimulation intensities.
The unimodal stimulation conditions are represented by empty geometric figures: yellow triangle for tactile (T), red diamond for muscle proprioception (P) and blue circle for visual (V) conditions. The bimodal conditions are represented by solid geometric squares: purple squares for proprio-tactile (TP), orange squares for proprio-visual (PV) and green squares for visuo-tactile (TV) co-stimulation. The trimodal conditions are represented by solid black squares (TPV). Statistical data are p-values obtained by two-way ANOVAs (post-hoc tests,*p<0.05, **p<0.01; NS: Not significant).

