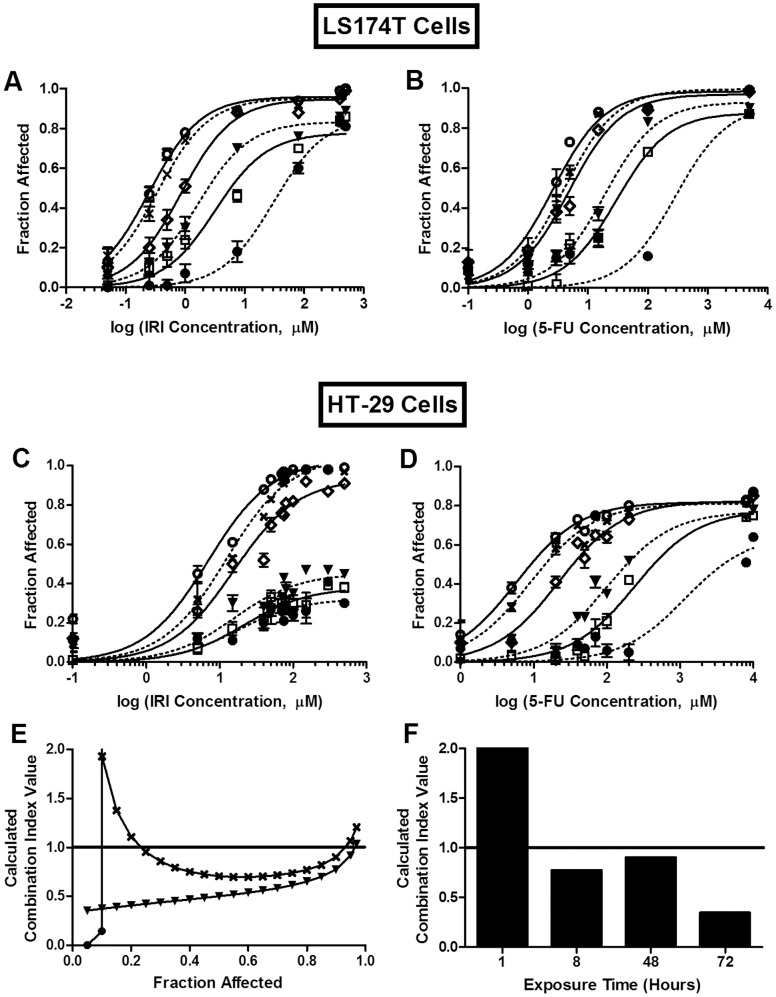
Figure 1. Exposure time dependency of IRI and/or 5-FU cytotoxicity in vitro.
A–D) Single agent exposure time dependency. LS174T (A and B) and HT-29 (C and D) cells were exposed to IRI (A and C) or 5-FU (B and D) for 1 (•, dotted line), 4 (□, solid line), 8 (▾, dotted line) 24 (⋄, solid line), 48 (X, dotted line), or 72 h (○, solid line). E) Combination exposure time dependency. HT-29 cells were exposed to IRI/5-FU (1∶1 molar ratio) for 1 h (•), 8 h (▾), or 48 h (X). F) Calculated CI values at FA = 0.9 for HT-29 cells exposed to IRI/5-FU (1∶1 molar ratio) for 1–72 h. A–D) Each point represents the mean +/− standard deviation (n = 3–9) from 2–3 experiments, each completed in triplicate. E, F) Each point or bar represents a combination index value calculated from cytotoxicity data compiled from 2–4 separate experiments, each completed in triplicate. CI of 0.8 to 1.2 suggests additive interactions; CI <0.8 suggests synergistic interactions; and CI >1.2 suggests antagonistic interactions.

