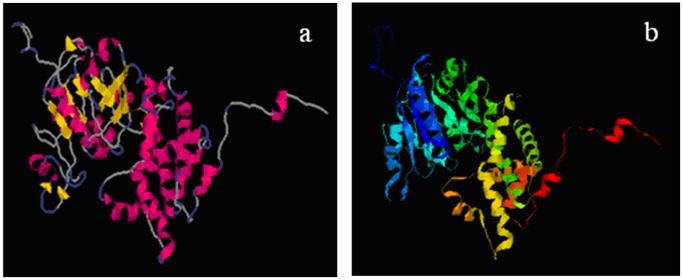
Figure 4. Schematic representation of three-dimensional models of the D.salina G3PDH.
(a) Comparative modeling was performed using 3D-JIGSAW. (b) Comparative modeling was performed using CPH models. The α-helix and β-sheet regions of the putative protein are indicated with ribbons and arrows, respectively. The loop regions are also designated in the schematics.

