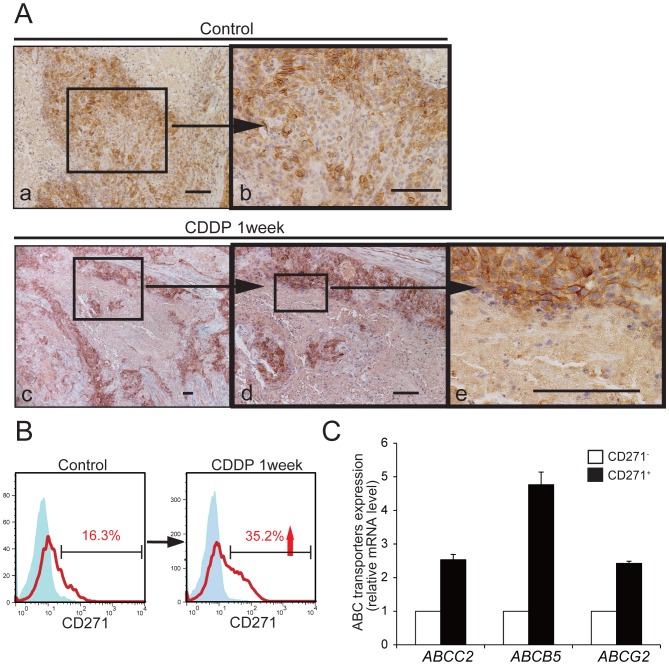
Figure 4. In vivo Chemoresistance of CD271+ cells.
(A) HPCM1- transplanted mice were treated with 7.5 mg/kg of CDDP for a week, then the generated tumors were analyzed by IHC for CD271. Boxed areas are linked to their respective high-magnification images by horizontal arrows. Scale bar: 100 µm. (B) FACS analyses for CD271 in HPCM1 cells derived from mice with or without CDDP treatment. (C) Expression of ABCC2, ABCB5, and ABCG2 in CD271+ and CD271− cells analyzed by real-time RT-PCR. Transcript levels were normalized to those of GAPDH, and the fold increase of each gene expression levels in CD271+ cells versus CD271− cells are shown. Values are the mean±SD of triplicate experiments.

