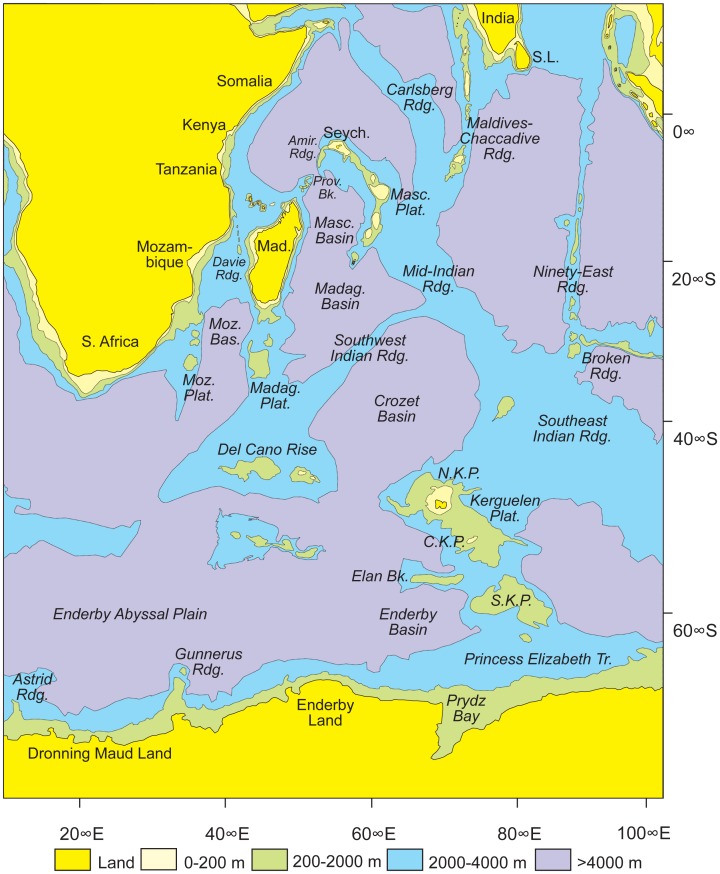
Figure 1. Simplified bathymetric map of the western and central Indian Ocean, and adjacent Southern Ocean.
Note that the 0–200 m bathymetric interval around Antarctica is not portrayed due to a lack of detailed information in the areas adjacent to the continent. Based on the GEBCO [153] chart.

