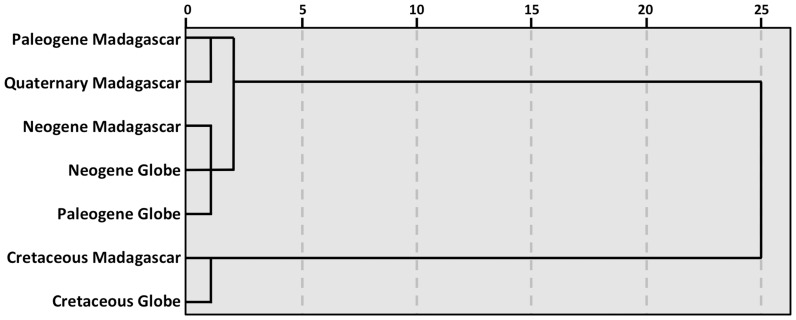
Figure 4. Dendrogram based on the correlations between assemblages or the averages of assemblages, joining clusters for which the average similarity between members is the greatest.
Each group is a vector comprised of 4 numbers (the percentages of amphibian, reptile, bird, and mammal families, or in the case of the Cenozoic for Madagascar, the percentages of clades belonging to each class known or inferred to have arrived independently).

