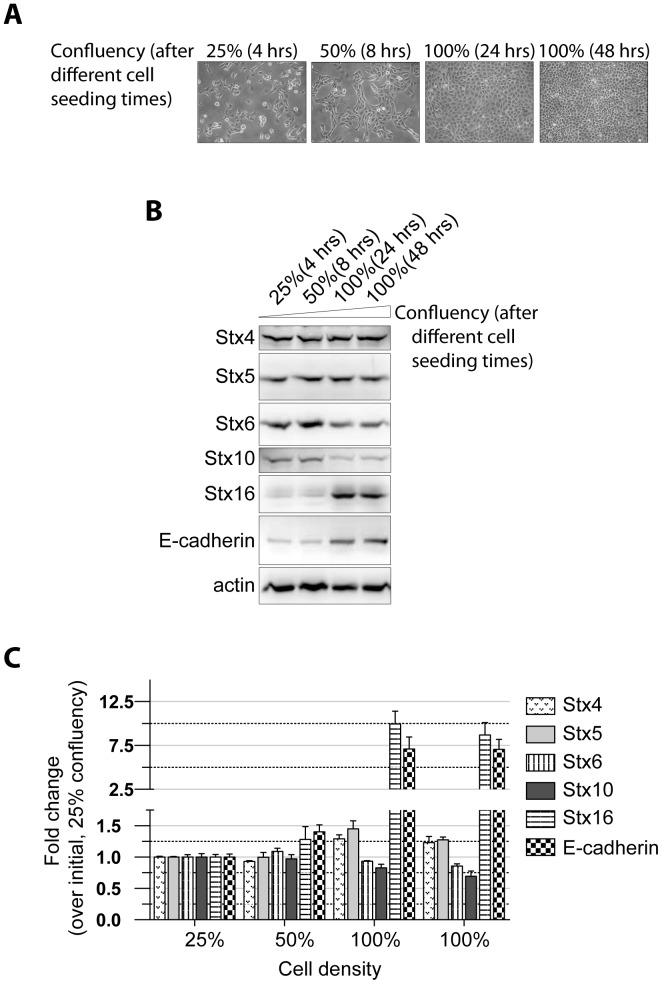
Figure 1. Expression of Stx proteins in MDCK cells over the development and maintenance of a confluent monolayer.
(A–C) MDCK cells (3.5×10⁵ cells/35 mm dish) were seeded and analyzed after achieving varying degree of confluency. (A) Confluency of MDCK monolayers at indicated times after initial cell seeding. Representative images are shown. (B) Western blotting for Stx protein and E-cadherin expression. Total cell lysates were prepared from cultures at varying degrees of confluency. (C) Quantitation of band densities in B. Values represent relative protein levels at different cell densities, after normalization to the 25%-confluency value, set arbitrarily at 100%. The percentage represents the mean (±SD) for n = 3.

