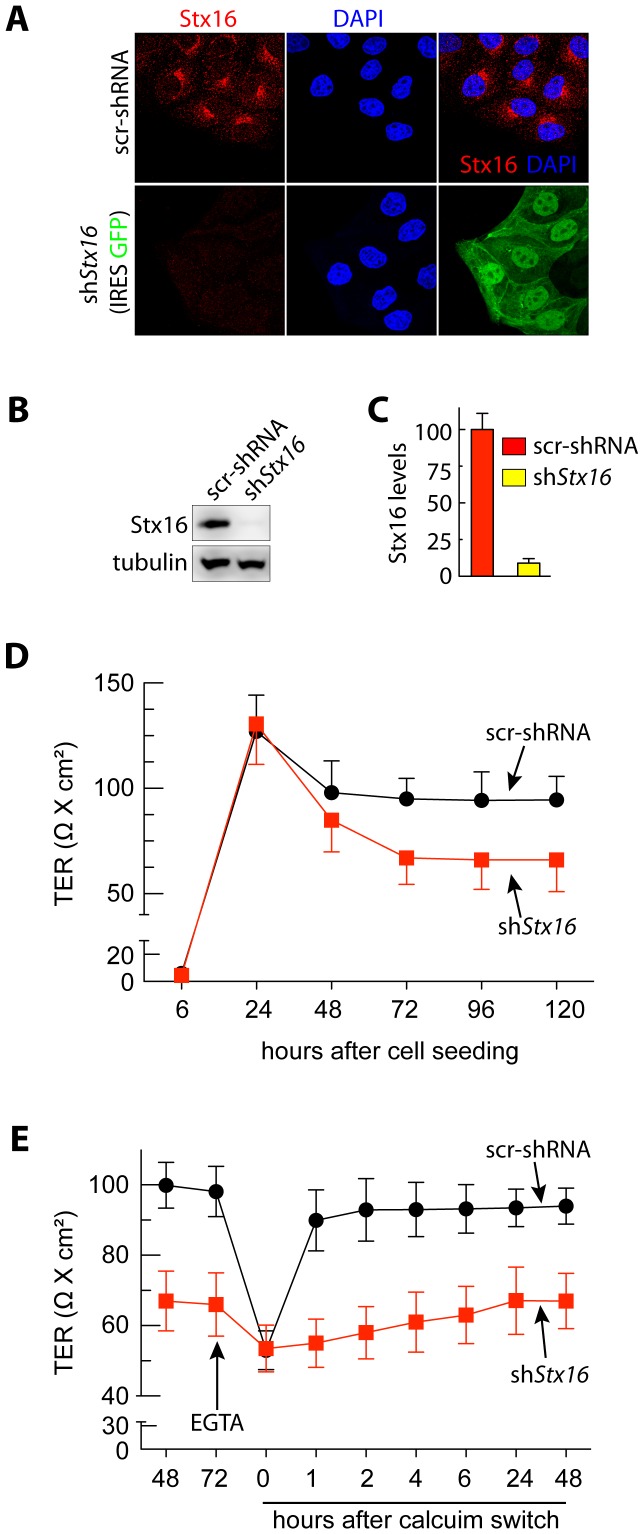
Figure 2. Stx16-depleted MDCK monolayer show decreased transepithelial resistance (TER).
(A) Immunofluorescence staining for Stx16 expression in src-shRNA-MDCK and shStx16-MDCK cells. (B) Western blotting of Stx16 expression in src-shRNA-MDCK and shStx16-MDCK cells. (C) Quantitation of band densities from B. Values represent relative protein levels after normalization to an arbitrary value of 100% for src-shRNA expressing cells. The percentage represents the mean (±SD) for n = 3. (D) Transepithelial resistance (TER) measured in monolayers generated from src-shRNA-MDCK and shStx16-MDCK cells at indicated time intervals. (E) Recovery of TER in MDCK monolayers following a Ca2+-switch. Stx16 depletion caused a delayed recovery of TER. Graph represents the averages from 3 independent experiments (plus 3 replicates per experiment) and error bars show SEM.

