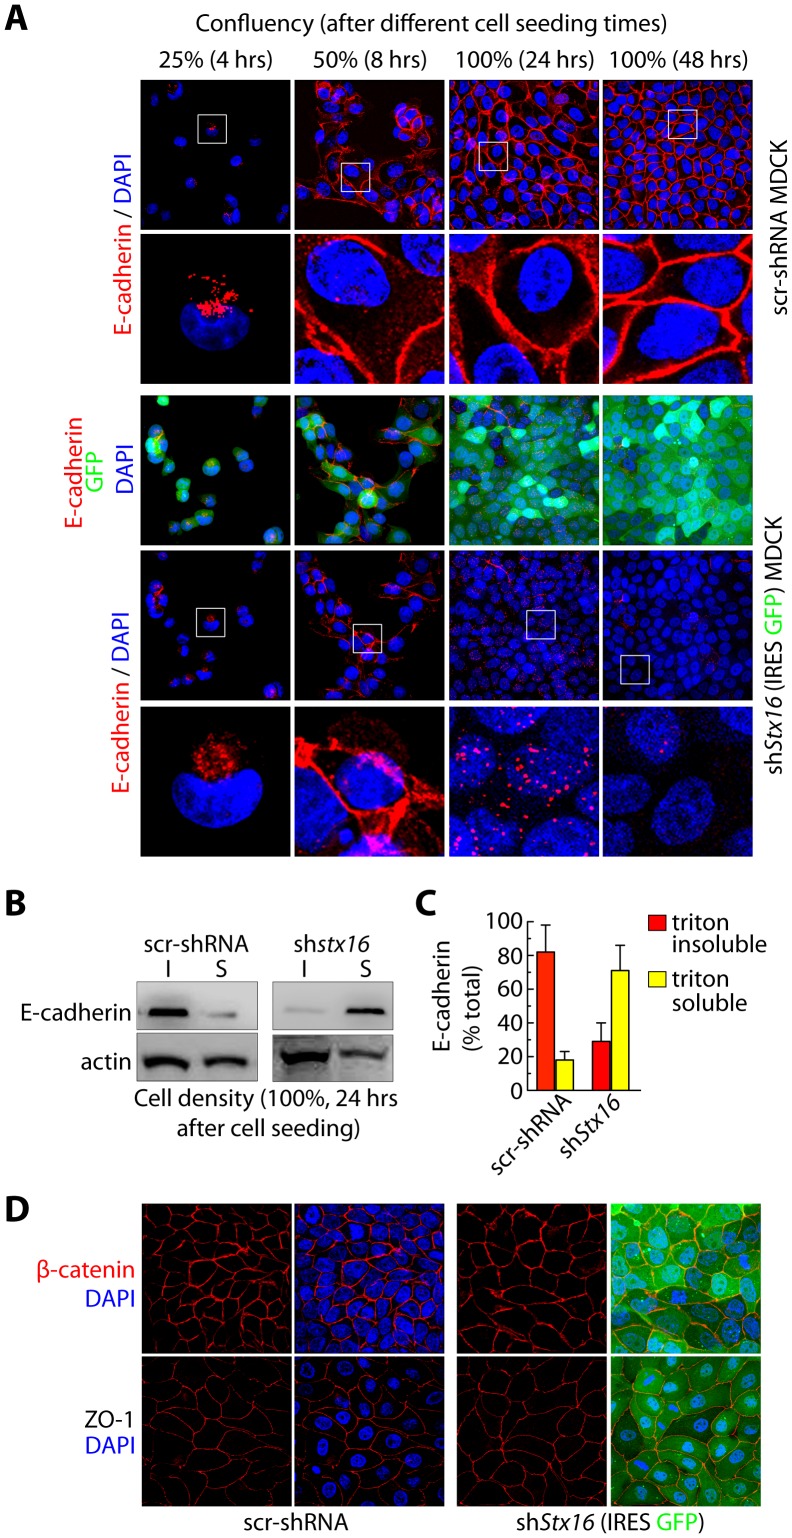
Figure 3. Stx16 depleted MDCK cells show decreased E-cadherin at cell-cell junctions.
(A) Immunofluorescence-based analysis of E-cadherin localization at MDCK cell-cell junctions during the development and maintenance of a monolayer. (B) Western blotting for E-cadherin following preparation of Triton-soluble (S) and -insoluble (I) fractions from scr-shRNA and shStx16 MDCK confluent monolayer 24 hrs after cell seeding. (C) Densitometric quantitation of E-cadherin bands as in B. Values represent the relative protein levels after normalization to an arbitrary value of 100% for src-shRNA expressing cells. The percentage represents the mean (±SD) for n = 3. (D) Immunofluorescence-based analysis of -catenin localization in scr-shRNA and shStx16 MDCK at various times post cell seeding.

