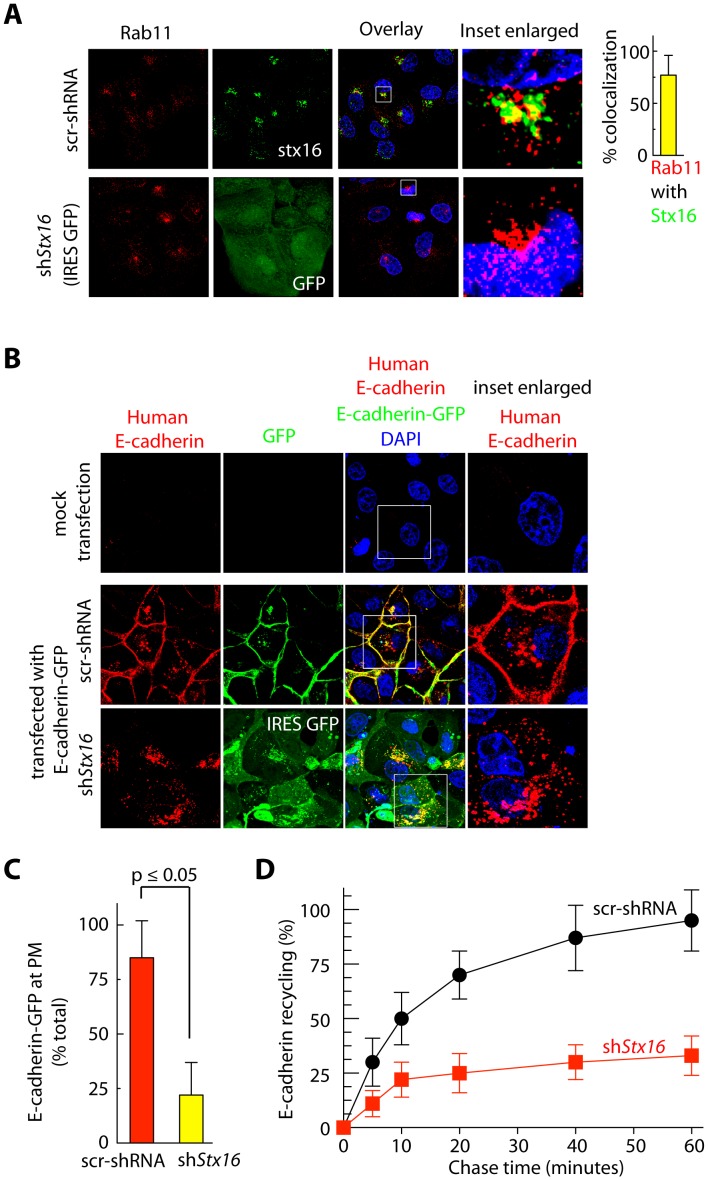
Figure 4. Stx16 colocalizes with Rab11 and E-cadherin in MDCK cells.
(A) Immunofluorescence based assessment of Rab11 localization in control (src-shRNA) and shStx16-expressing MDCK cells. Graph show quantification of overlap in Stx16 and Rab11 fluorescence signals, from images as in A. Value represents mean ± S.D. (n = 50 cells for each condition, from 5 separate experiments; p≤0.05). Intracellular localization of Rab11 is not altered in Stx16-depleted MDCK cells. (B) Immunofluorescence-based analysis of localization of E-cadherin-GFP in cells stably expressing Src-shRNA or shStx16. (C) Quantitation of relative levels of E-cadherin-GFP at the PM (staining with human E-cadherin antibody) along the cell edges vs. total throughout the cell, quantified using the Metamorph software. Values represent relative change in the levels of E-cadherin-GFP at the cell periphery (calculated as % of total cell-associated protein). Results are expressed as mean ± SEM (n = 70 cells for each condition, from three separate experiments and p≤0.05). (D) MDCK cells stably expressing scr-shRNA or shStx16 were surface biotinylated. Samples were then incubated at 16°C for 30 min, to allow biotinylated E-cadherin to accumulate in endosomes. Biotin remaining at the surface was removed by treatment with MesNa and quenching of MesNa with iodoacetamide (0-min time point); samples were further incubated at 37°C for the indicated periods and, at each time point shown, subjected to a second MesNa treatment and then assessed for recycling of internalized E-cadherin. After each time point, the cells were lysed and the amount of biotinylated E-cadherin was determined by capture ELISA, using an Ab against E-cadherin. The fraction of internalized E-cadherin recycled back to the PM is expressed as a percentage of surface-labeled protein originally internalized (from the 0-min chase time point). Values are mean ± S.D. from 3 independent experiments; p≤0.005.

