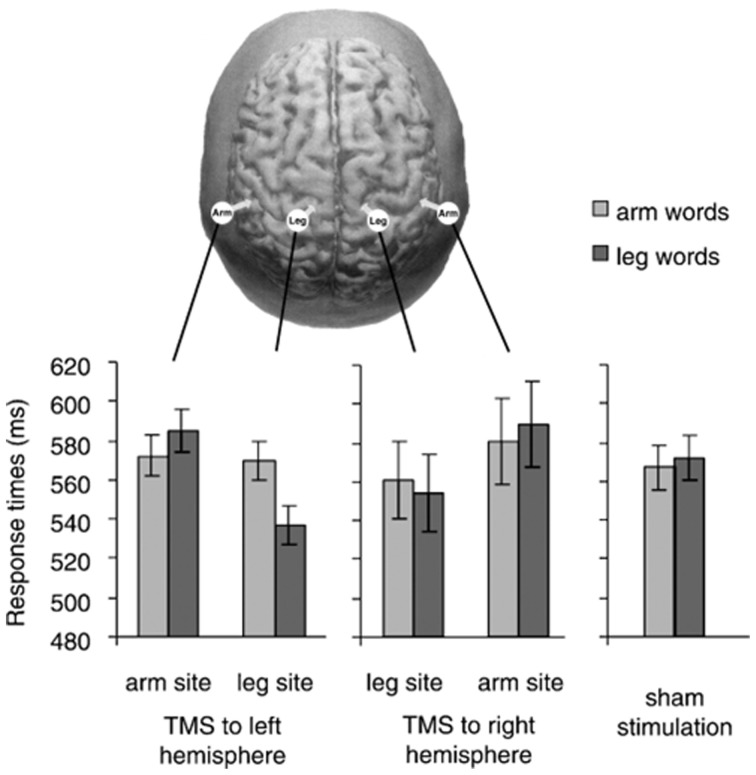
Figure 2.
In the top, the stimulation sites in Pulvermüller et al. (2005) are depicted. The graphs show response times to arm words and leg words in five TMS conditions (TMS to arm-M1 and leg-M1 of the right and left hemisphere, and sham stimulation). We notice that response times to arm words remained quite unchanged across the three critical conditions (TMS to the left arm-site, to the left leg-site and sham stimulation). With permission from (Pulvermüller et al., 2005).

