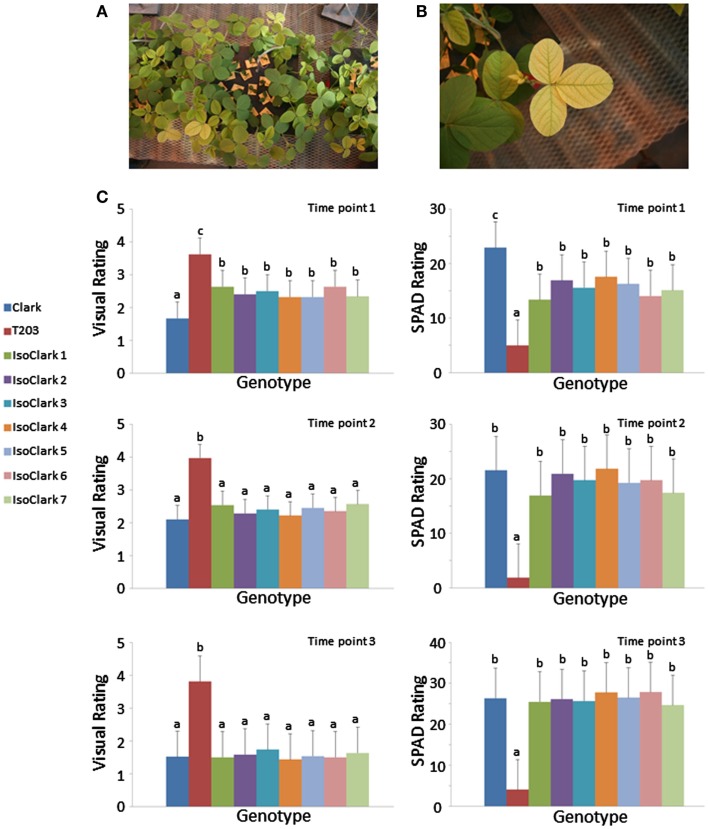
Figure 4.
Yellowing responses of the “IsoClark” sub-lines to hydroponic treatments of limited iron. (A) All nine genotypes (including “Clark” and “T203” control) were grown together within each treatment unit. (B) Conspicuous yellowing of a “T203” trifoliate. (C) Mean separation (LSD) for phenotypes as scored by visual ratings and SPAD measurements over three time points. Letters a, b, c, indicate when treatment means are in significantly different groups.

