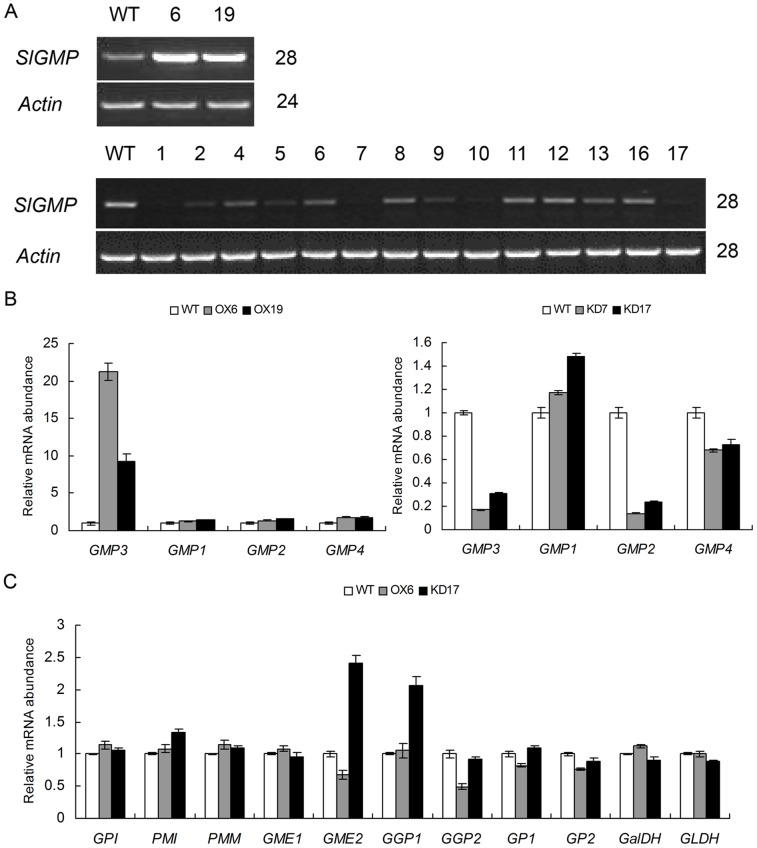
Figure 3. Expression analysis of four SlGMPs and other AsA biosynthesis-related genes in SlGMP3 transgenic plants.
(A) RT-PCR analysis of SlGMP3 expression in the young leaves of two SlGMP3-OX lines (upper panel) and 17 SlGMP3 RNAi lines (bottom panel). The PCR circle numbers are indicated on the right. (B) Relative expression analysis of four members of SlGMP gene family in the young leaves of lines OX6 and OX19 (left) and lines KD7 and KD17 (right) via real-time RT-PCR. (C) Relative expression analysis of AsA biosynthesis-related genes in the young leaves of lines OX6 and KD17 via real-time RT-PCR. Data were obtained by normalizing against Actin and shown as a percentage of wild-type plants.

