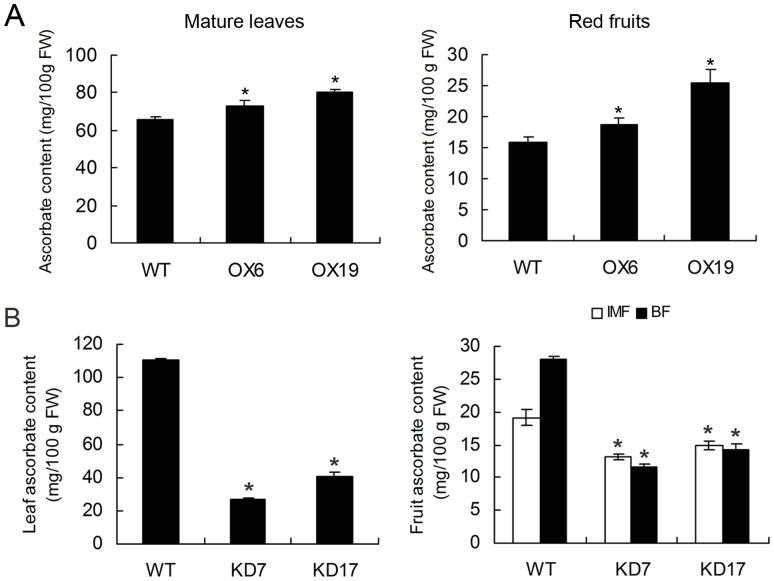
Figure 4. AsA content analysis in SlGMP3 transgenic plants.
(A) Total AsA contents in the mature leaves (left) and red fruits (right) of lines OX6 and OX19. (B) Total AsA contents in the mature leaves (left) and immature green fruits (IMF) and breaker fruits (BF) (right) of lines KD7 and KD17. As the experiments of (A) and (B) were carried at two separate times, there were some differences in AsA contents in leaves of the wild-type tomato plants. Data are presented as mean ± SD of four independent plants per line. Asterisk indicates significant differences from the control (P>0.95).

