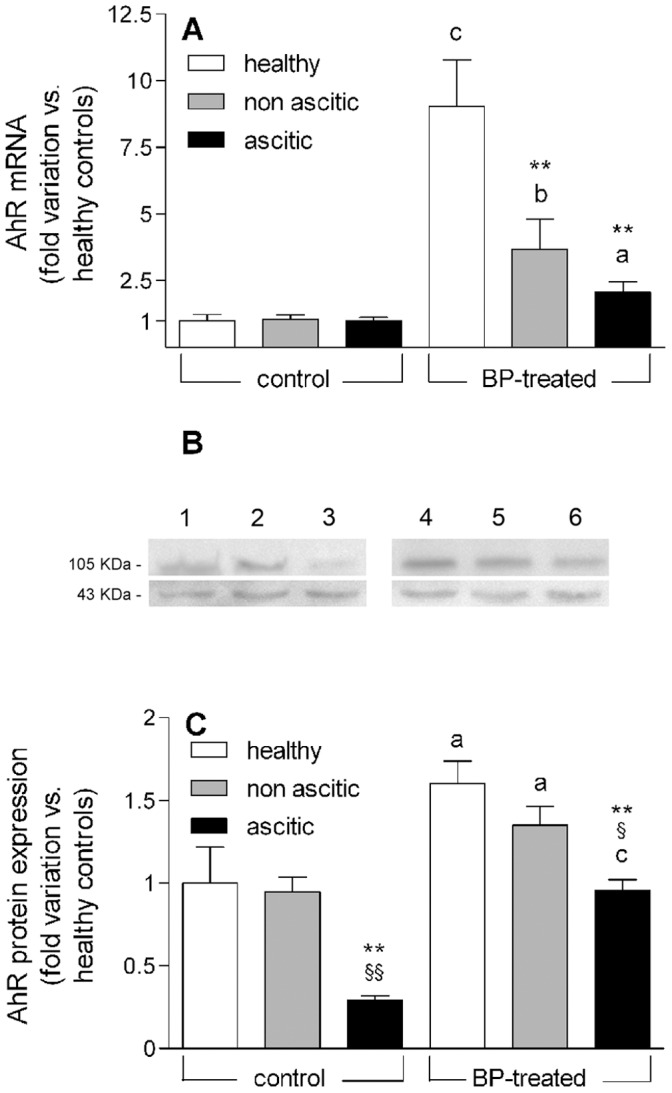
Figure 5. AhR gene transcription levels and protein expression in control and BP-treated rats.

(A) Experimental data showing AhR mRNA levels are reported as fold variation compared with healthy control rats. (B) Representative Western blots showing the separation of total liver protein extracts obtained from control and BP-treated rats. The amounts of proteins loaded per lane were 60 µg. The ticks indicating 105 and 43 KDa correspond to the AhR and β-actin bands, respectively. Lanes 1 to 3: healthy, non-ascitic and ascitic control rats; lanes 4 to 6: healthy, non-ascitic and ascitic BP-treated rats. (C) Amount of AhR protein in livers from control and BP-treated rats normalized to the signal intensity of the corresponding β-actin band and shown as fold variation compared with healthy control rats. All results are means ± S.E. of data obtained from 8 rats per group. **P<0.01 vs. healthy rats. §P<0.05, §§P<0.01 vs. non-ascitic cirrhotic rats. aP<0.05, bP<0.01, cP<0.001 vs. control rats of the same group.
