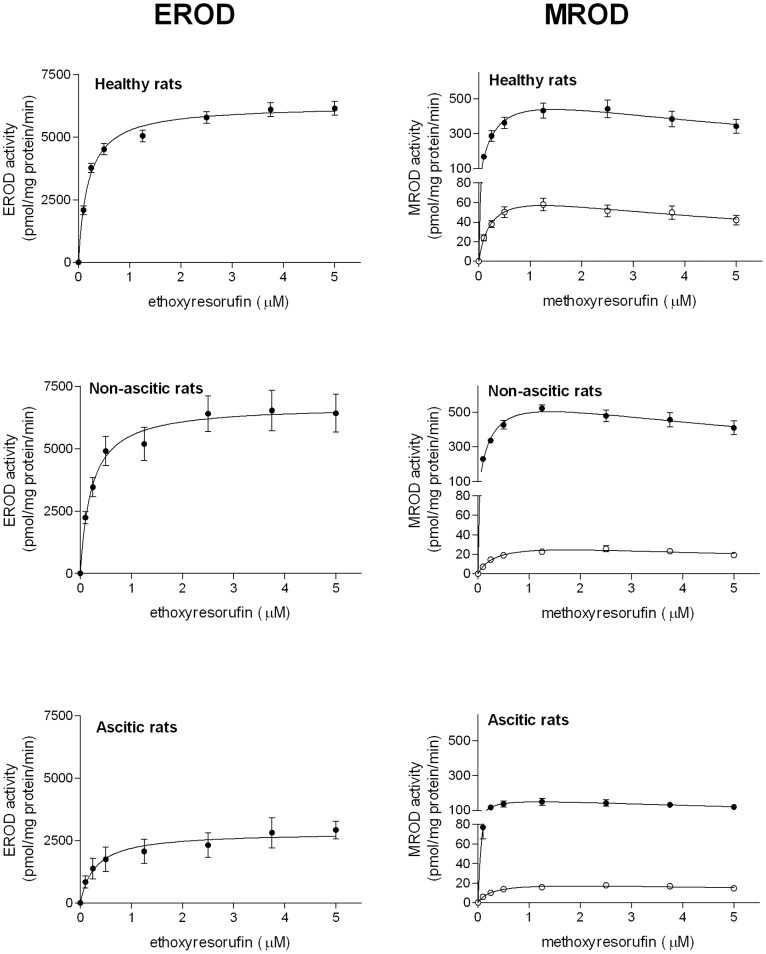
Figure 6. Kinetics of EROD and MROD activities in liver microsomes.
Microsomal activities of control (○)BP-treated (•) rats. Results are means ± S.E. of data obtained from 8 rats per group. For each rat, activity determinations were performed in triplicate. S.E. is not shown where the size of data points is larger than the S.E. bar.

