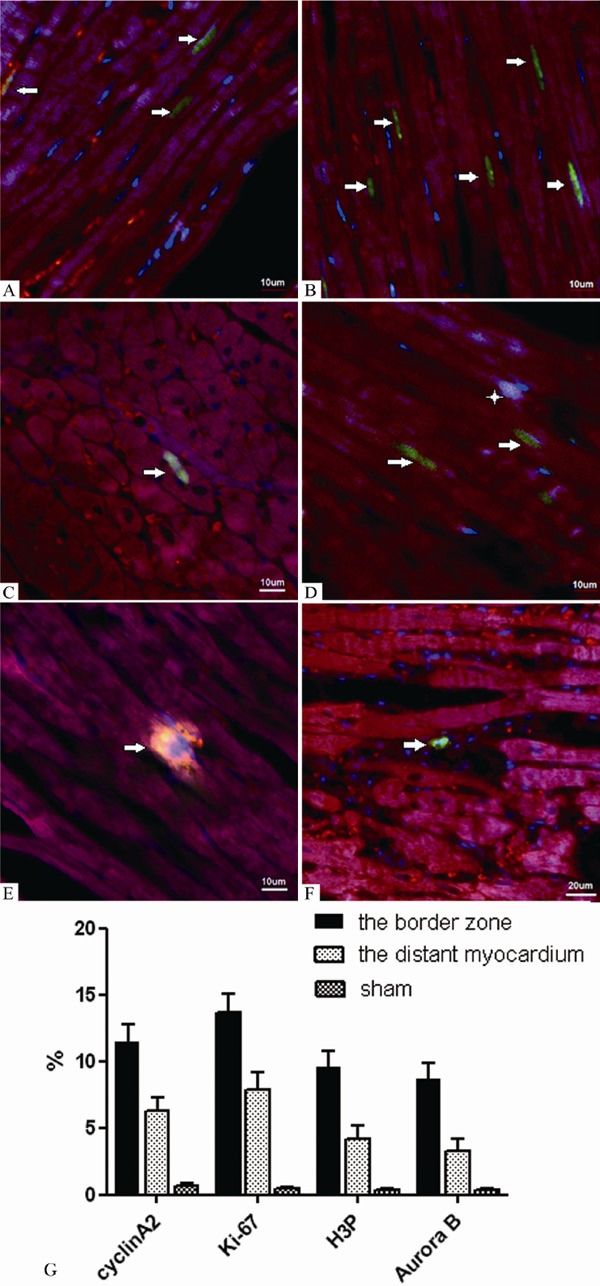
Figure 5.

Detection of cyclin A2, Ki-67, H3P and Aurora B expression in cardiomyocytes from infarcted hearts by immunofluorescence analysis (border zone, 2 weeks after infarction) (A-E. ×100 magnification; F. ×60 magnification). Both dark red and red fluorescence show staining of the myocyte cytoplasm by the sarcomeric α-actin antibody, while blue fluorescence shows the nuclei. In panel A, the green fluorescence documents the localization of cyclin A2 in the nuclei (arrows). In panel B, the green fluorescence documents the localization of Ki-67 in the nuclei (arrows). In panels C and D, the green fluorescence documents the localization of H3P (arrows), while the bright fluorescence shows the overlay of the red, blue and green fluorescence (asterisk). In panel E, the bright fluorescence shows a combination of the accumulation of actin and Aurora B by overlay of the dark red and green fluorescence (arrow). In panel F, the green fluorescence documents the localization of Aurora B (arrow). G. The percentage of cyclin A2, Ki-67, H3P, Aurora B-positive cells in the border zone, the distance of cardium, sham group (mean ± SD).
