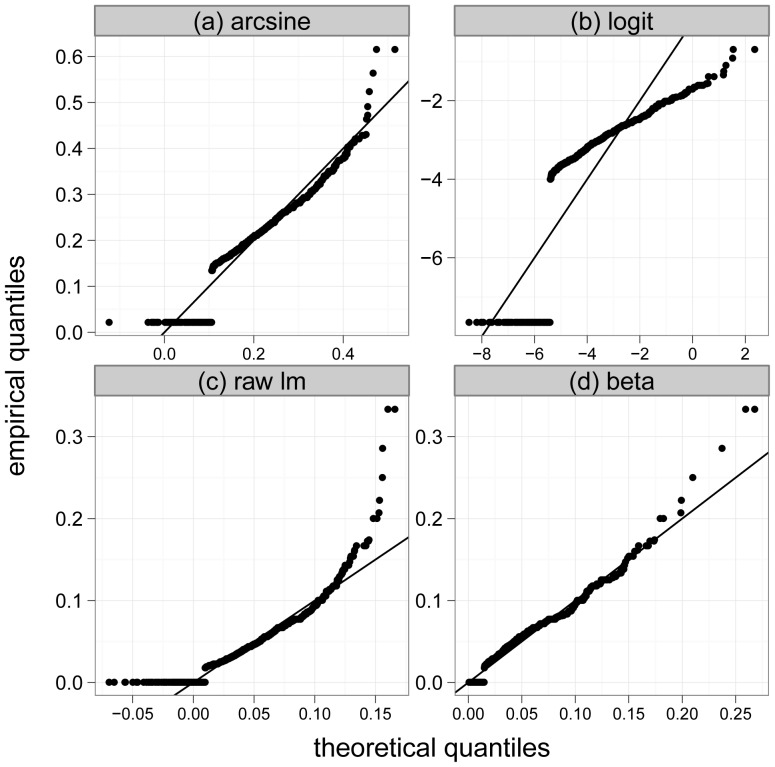
Figure 3. Normal quantile-quantile plots.
Normal quantile-quantile plots of arcsine-square-root-transformed (“arcsine”), logit-transformed (“logit”) and untransformed (“raw lm”) EPHEptax values (panels (a) - (c)). Panel (d) shows a beta quantile-quantile plot using the untransformed EPHEptax values. It is seen that EPHEptax is best approximated by a beta distributed random variable.

