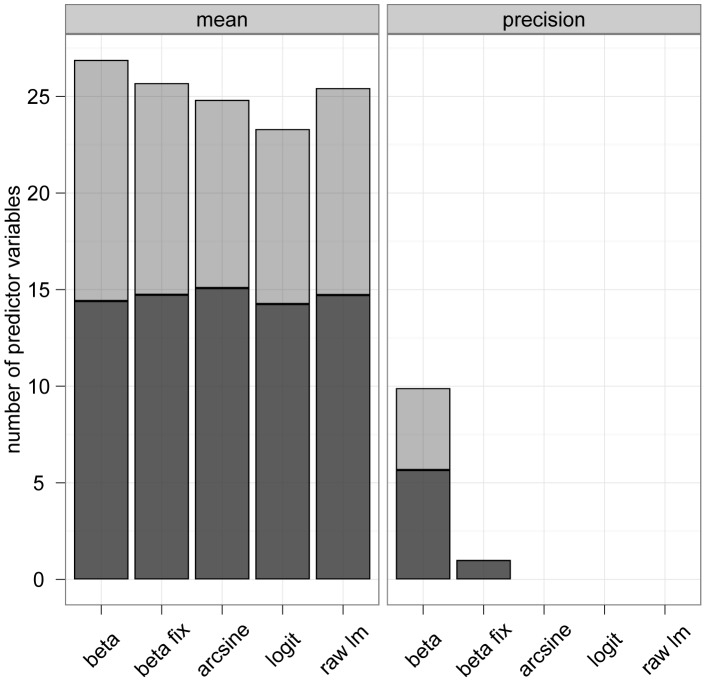
Figure 5. Number of selected predictor variables.
Analysis of the NLA Data. The two panels contain the number of selected predictor variables (averaged over 100 bootstrap samples) for various modeling approaches. Dark grey bars represent linear effects, light grey bars represent non-linear effects. In case of beta regression with fixed precision parameter (“beta fix”), the precision model contains only one predictor (namely, the intercept).

