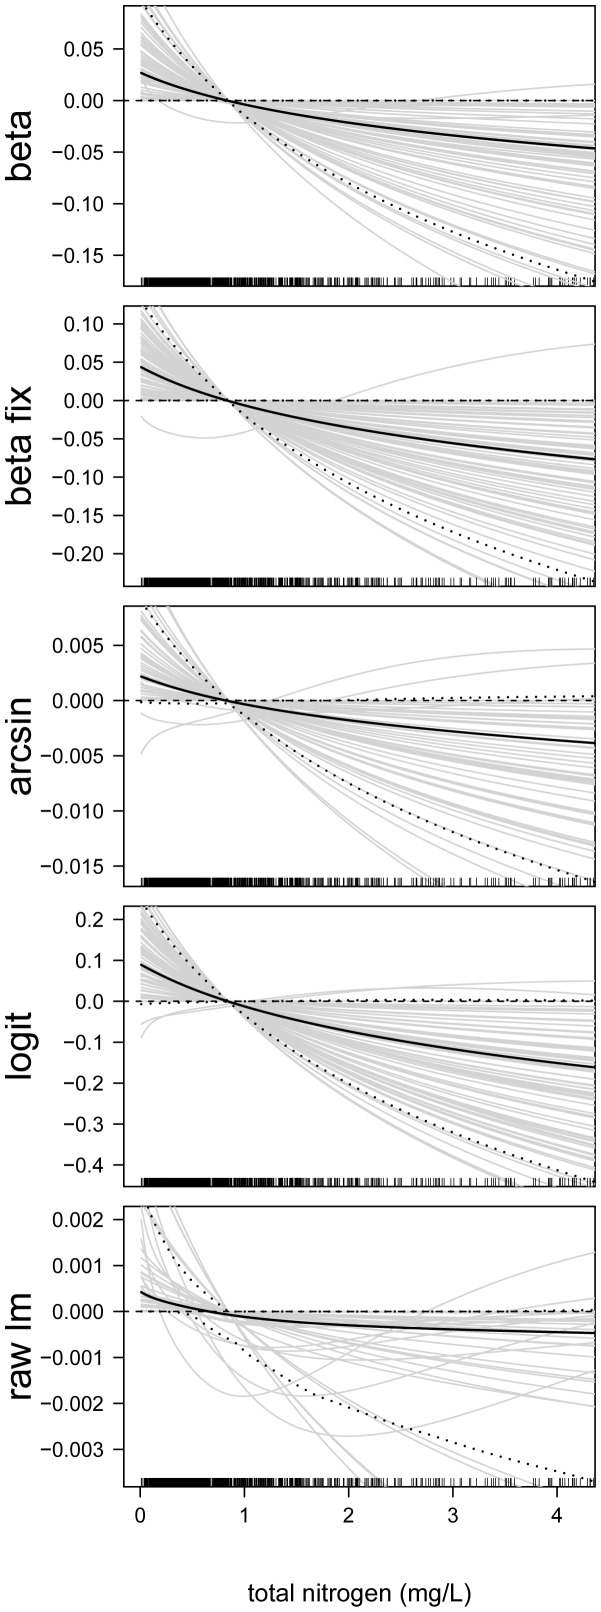
Figure 9. Function estimates for the total nitrogen concentration.
Analysis of the NLA Data. The five panels contain the function estimates for the total nitrogen concentration (computed from 100 bootstrap samples). In case of beta regression, estimates present the effects of the total nitrogen concentration on the mean parameter  . Black lines correspond to the mean and the 0.05 and 0.95 quantiles of the function estimates. For reasons of interpretability, the range of the x-axes was restricted to the lower
  of the sample values.

