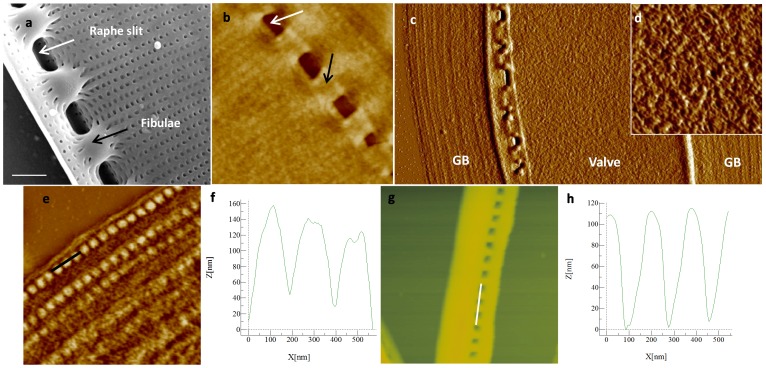
Figure 3. N. curvilineata silica structure and organic matrix.
a; SEM micrograph of the proximal side of the valve (scale bar 1 µm). b–h; AFM micrographs and height profiles. Arrows in a and b show the fibulae (black) and the location of the raphe slit (white). b and d; Organic matrix associated with the valves. c; organic matrix associated with the valve and girdle bands (GB). e; organic matrix associated with the GB and corresponding height profile (F). g; Silicified GB and corresponding profile (h). AFM scan sizes are 5, 20×9, 2, 3.1 and 2.7 µm for b–e and g, respectively).

