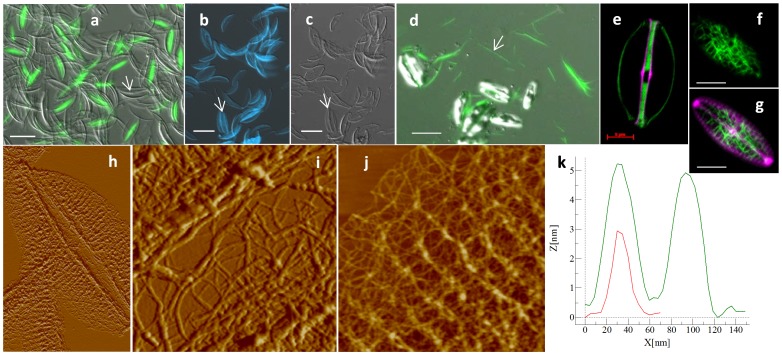
Figure 7. a–c; SDS cleaned cell wall of A. salina.
a; DIC and calcofluor (green fluorescence), b and c; DAPI (blue fluorescence) and corresponding DIC micrographs. Arrows show silica valve structures. d; A. salina in DIC and stained with calcofluor, arrow shows the fibrillar structure released into the medium. e; A. salina stained with calcofluor (green) and HCK123 (pink). f and g; N. cryptocephala stained with calcofluor and HCK123. h–j; AFM micrographs of the calcofluor stainable organic structure. h; height profile of single fibril from j. AFM scan sizes, 16.4×10.2, 1.7 and 2.8 µm for h–I, respectively, scale bars; a–d = 20 µm, e–f = 5 µm.

