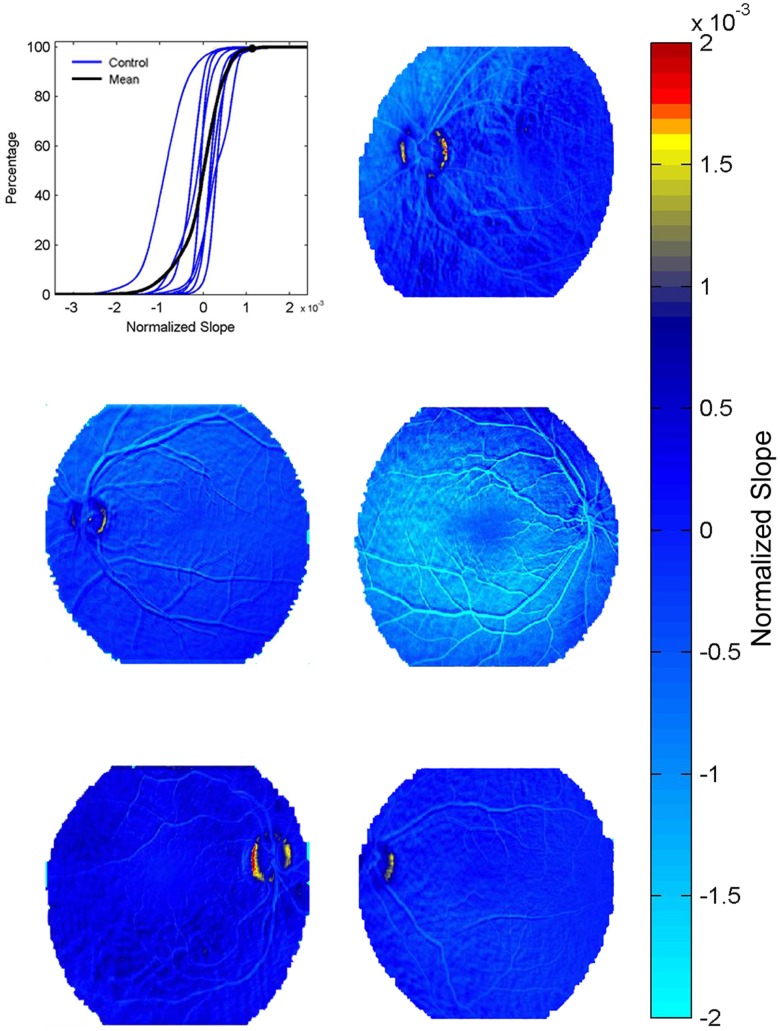
Figure 3. Permeability maps in healthy subjects.
Cumulative histogram of permeability values showing the averaged curve (black curve) of eight healthy volunteers (blue lines). Note the similar range of values for all controls. Retinal maps of 5 healthy controls are presented. Note that in all control, “high” values (yellow-red) are rare and are concentrated around the optic nerve.

