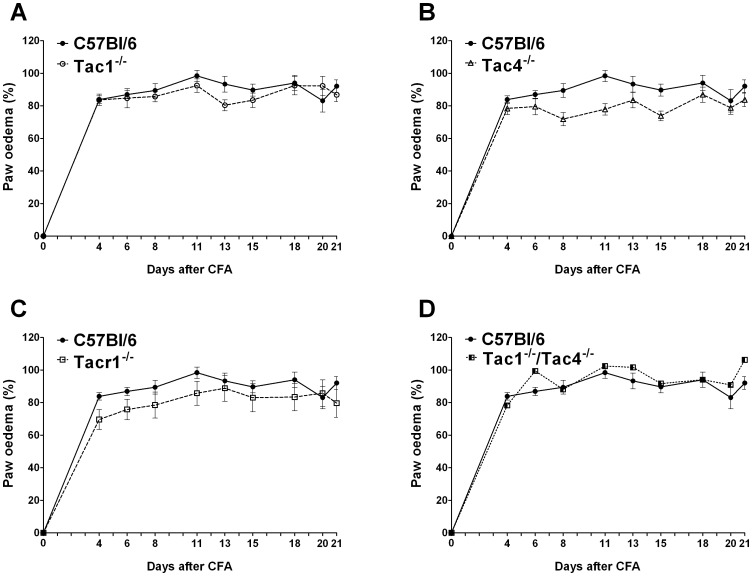
Figure 2. Adjuvant-induced oedema throughout the 21-day experimental period.
Each data point represents the mean ± SEM of the percentage increase of the paw volume of (A) Tac1−/−, (B) Tac4−/−, (C) Tacr1−/−, (D) Tac1−/−/Tac4−/− mice compared to the initial control values (n = 9–24 mice per group, two-way ANOVA followed by Bonferroni’s modified t-test).

