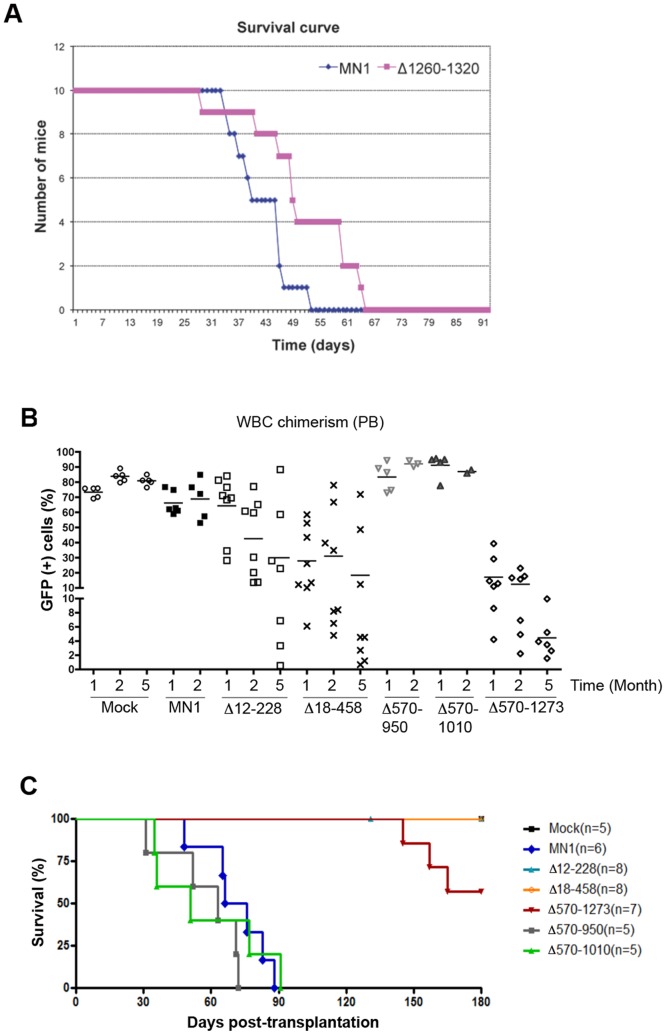
Figure 4. Deletions in MN1 that interfere with its leukemogenic activity.
(A) Comparison of in vivo leukemogenic activity of MN1 and Δ1260–1320 transduced bone marrow after transplantation in 10 lethally irradiated mice each. (B) FACS GFP analysis of the peripheral blood (PB) of mice that received transplants of BM expressing MN1 or the indicated MN1 mutants at the indicated time points after transplantation. WBC: White blood cells. (C) Kaplan-Meier survival plots of mice transplanted with bone marrow cells transduced with each indicated retrovirus.

