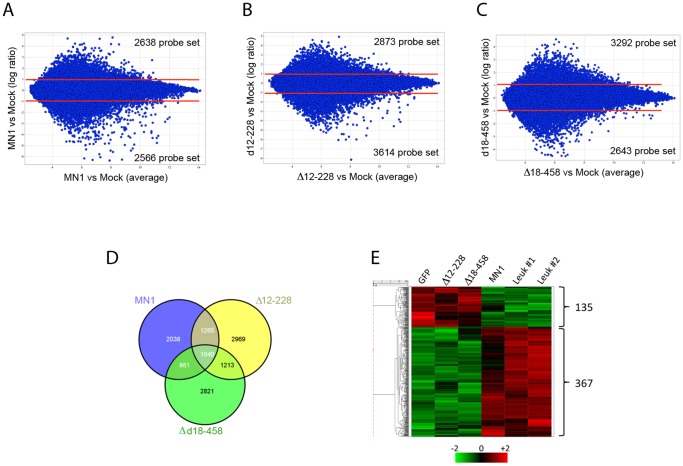
Figure 6. Expression profile analysis of MN1, 12–228 and 18–458 cells.
(A, B, C) Pair wise comparison of CMP/GFP+ cells transduced with MN1, Δ12–228, Δ18–458 retrovirus with CMP/GFP+ cells transduced with empty vector (mock). (D) Venn diagram showing the number of probe sets that are differentially expressed in the pair wise comparison in A, B and C. (E) Hierarchical clustering of 502 transcripts with >2-fold differential expression in MN1 CMP/GFP+ cells and two bulk leukemic MN1-bone marrow (Leuk #1, #2) as compared with CMP/GFP+ cells transduced with empty vector (GFP). Heat map indicates expression relative to the mean in standard deviation units.

