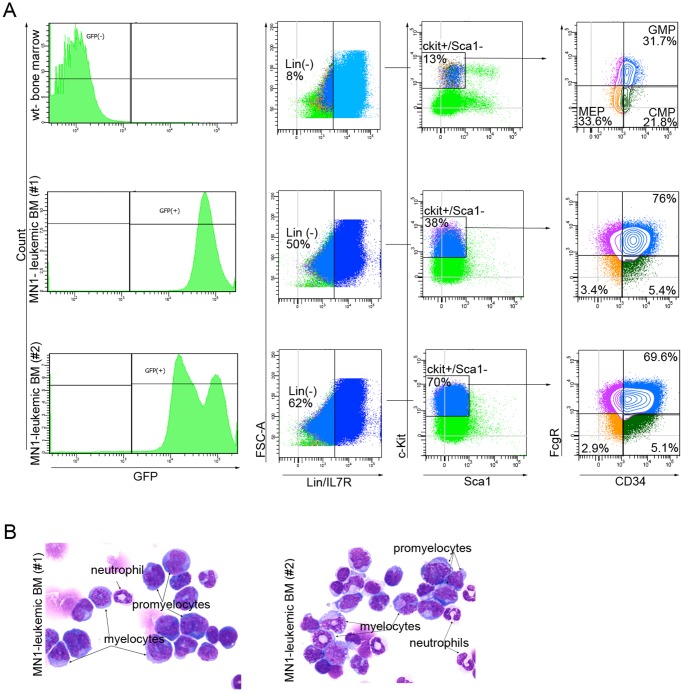
Figure 7. FACS analysis of leukemic bone marrow samples of MN1-mice.
(A) FACS analysis of bone marrow samples from a wild type (wt-bone marrow) and two moribund MN1-mice to determine the size of the CMP, MEP and GMP populations. GFP− and GFP+ gates were used for wild type or MN1-bone marrow cells, respectively. (B) Giemsa staining of leukemic bone marrow cells of the same mice as in A showing their morphology. Arrows indicate different myeloid cell types.

