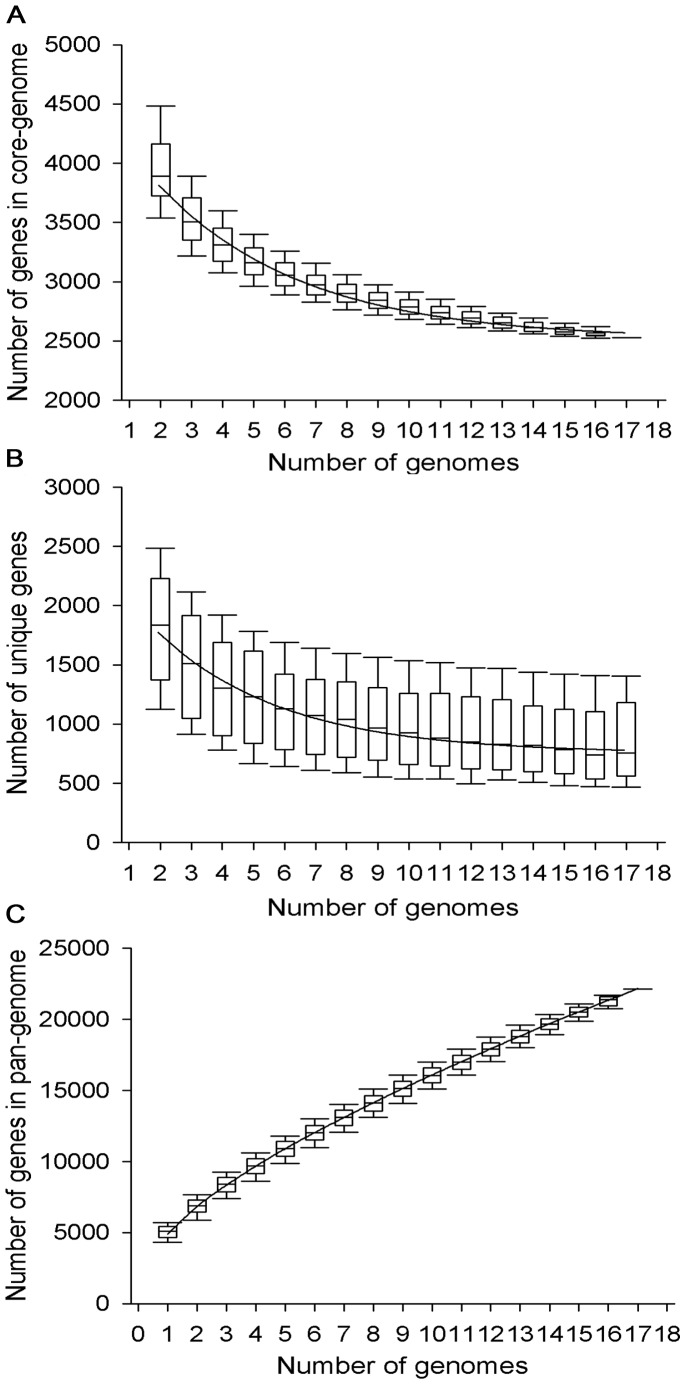
Figure 2. Nocardiopsis core, unique, and pan-genome evolution according to the number of sequenced genomes.
The upper and lower edges of the boxes indicate the first (25th percentile of the data) and third (75th percentile) quartiles, respectively. The central horizontal line indicates the sample median (50th percentile) of 1,000 different random input orders of the genomes. The central vertical lines extend from each box as far as the data extend, to a distance of at most 1.5 interquartile ranges (i.e., the distance between the first and third quartile values). (A) Number of genes in common for a given number of genomes of different species. The exponential decay model based on the median value for the conserved core genes shows that the core-genome had a minimum of 2,517 genes (11% of the pan-genome). (B) Number of unique genes for a given number of genomes of different species. Decreasing numbers of unique genes per genome with increasing numbers of genomes was examined. The curve shows the exponential decay model based on the median value for unique genes when increasing numbers of genomes were compared. About 755 new unique genes will be added to the pan-genome for every new species genome sequenced, according this model. (C) Total number of non-orthologous genes for a given number of genomes of different species. With 17 sequenced genomes, the pan-genome has 22,143 total genes. The Nocardiopsis pan-genome is open and its size grows with the number of independent species sequenced.

