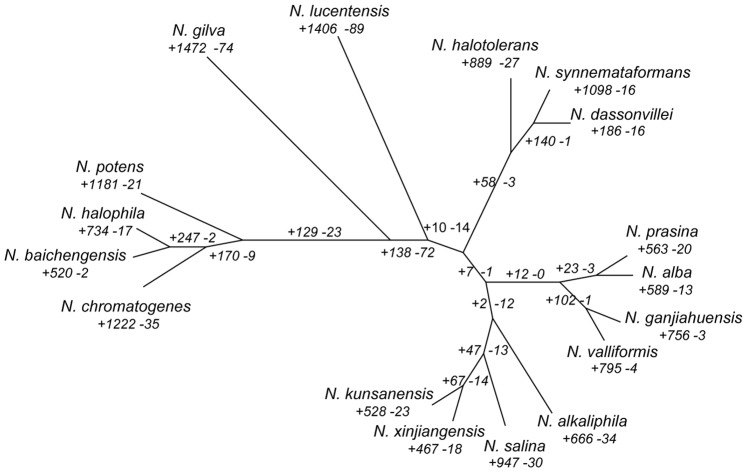
Figure 4. Gene content dendrogram and distribution of lineage-specific gene clusters.
A dendrogram constructed by hierarchical clustering (UPGMA) based on dissimilarities in gene content (presence/absence of protein families) among the 17 species of Nocardiopsis. Dissimilarities were measured using Jaccard distance (one minus the Jaccard coefficient), ranging from 0 to 1. Numbers near each branch indicate corresponding events of homologous gene cluster acquisition (‘+’) and loss (‘–’). For example, 67 gene clusters were gained in the genome of the common ancestor of N. kunsanensis and N. xinjiangensis and do not contain a homolog in the other 15 genomes analyzed. Similarly, 14 gene clusters were missing in that ancestor’s genome but are present in all other 15 genomes.

