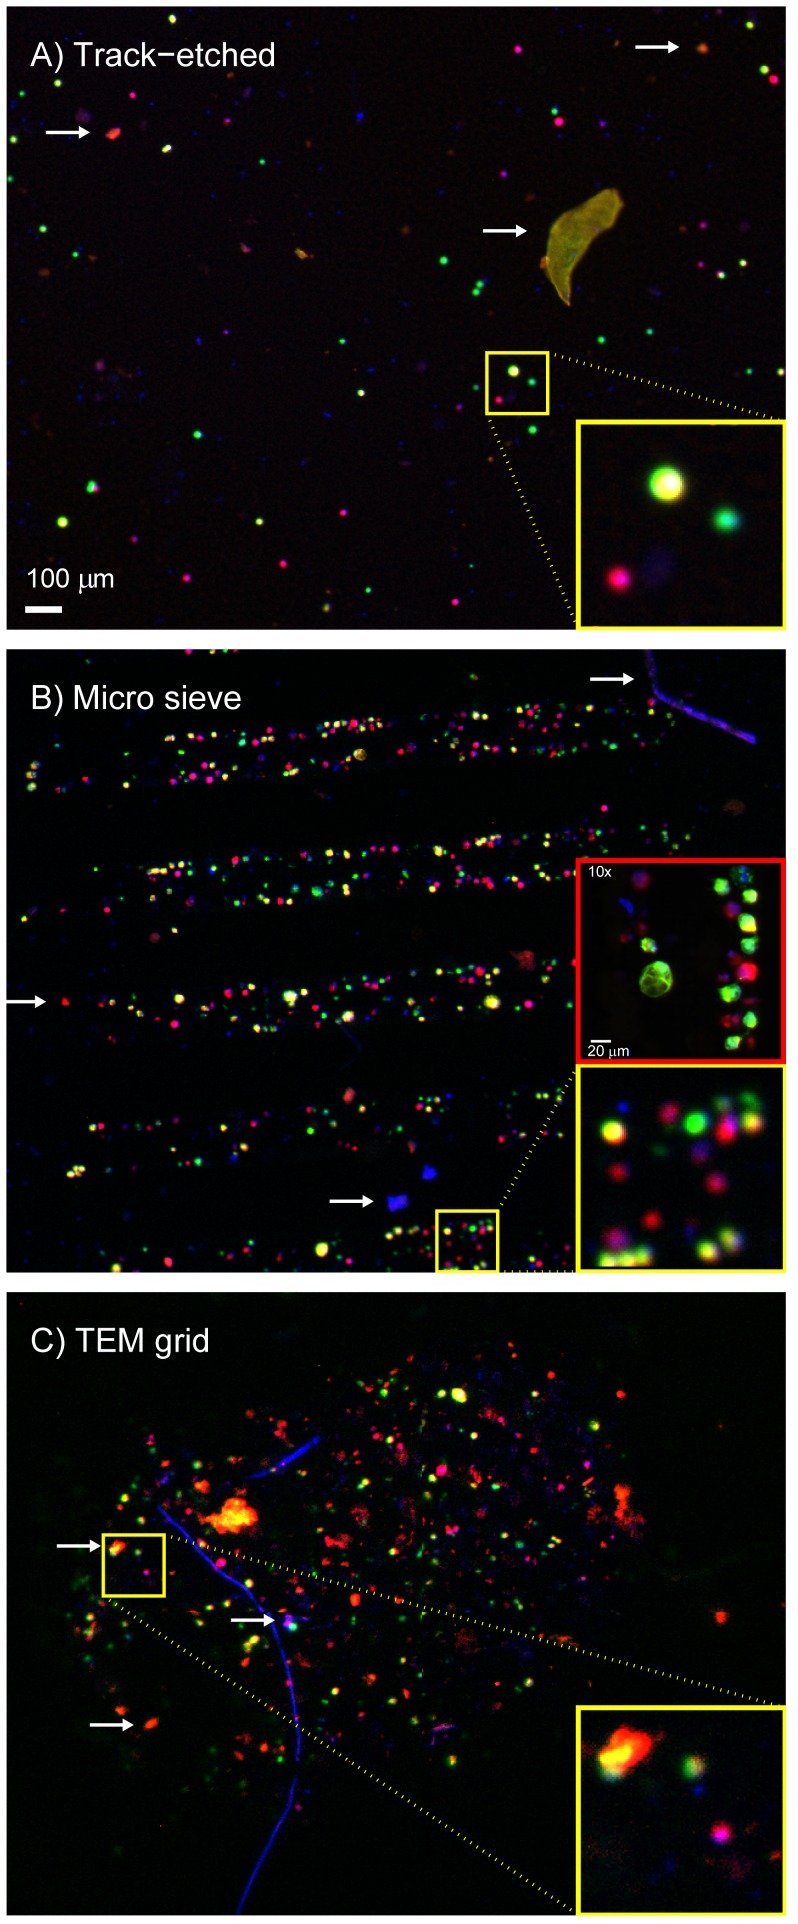
Figure 2. Images of cells on all filters.
Panel A shows a track-etched filter, panel B a microsieve filter and panel C a TEM grid filter. The images show false color fluorescent images taken of pre-stained cells enriched from a whole blood sample. Hoechst 33342 stain is shown in blue, Celltracker Orange in red, and Celltracker Green in green. In the false color MDA-231 cells are red, PC3-9 cells green and SKBR-3 cells yellow. Several types of autofluorescent and/or Hoechst positive debris were found on the filters, examples are indicated with white arrows. This debris is also found in unspiked samples. Due to the low number of pores and the high porosity of the microsieves and TEM grids, cells are very close to each other. To better distinguish cells on these filters, imaging with a 10x objective was necessary for determination of cell recovery as shown in the red insert in panel B. This was not possible with the track-etched filters because they were not sufficiently flat to have all cells in focus.

