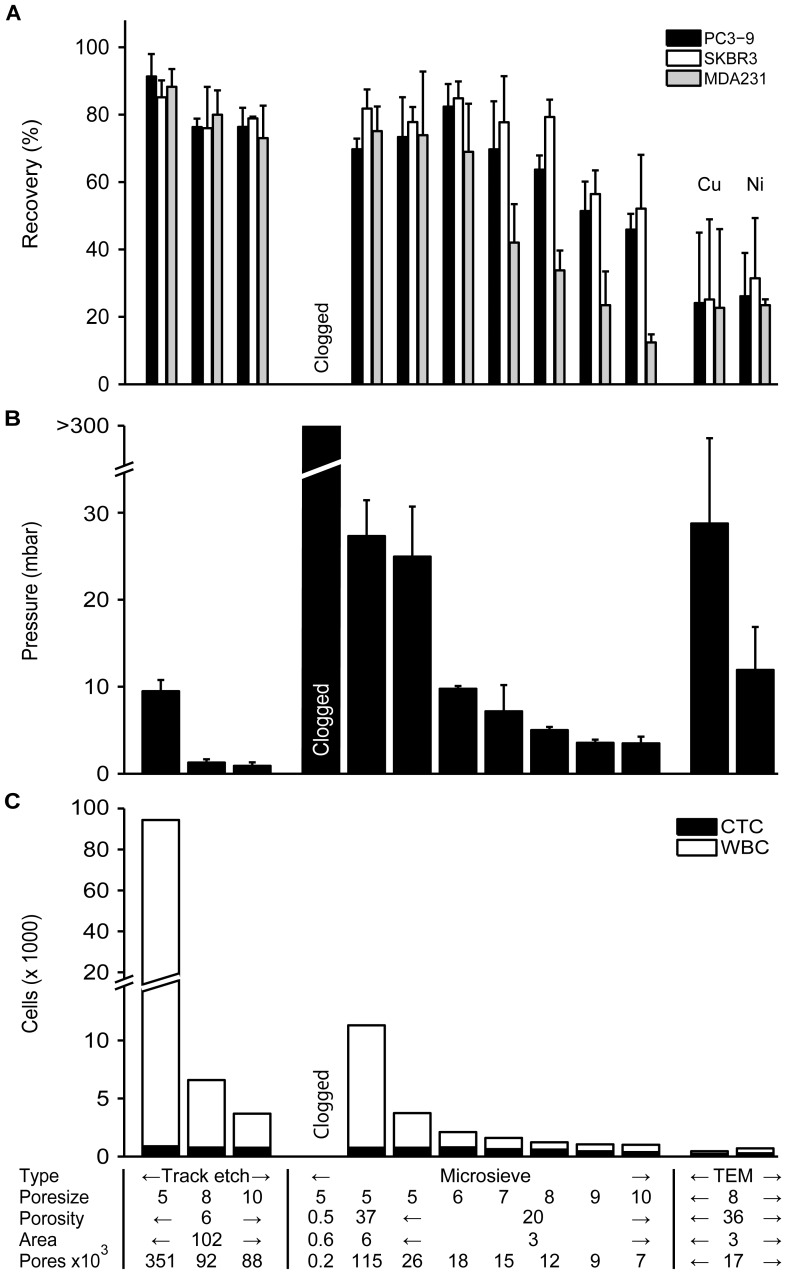
Figure 3. Comparison between different filter types.
Panel A shows recovery for SKBR-3, PC3-9 and MDA-231 cell lines. Bar height represents recovery with whiskers showing 1 standard deviation. No recovery was determined for the 0.5% porosity microsieve due to clogging while filtering. Panel B shows the peak pressure achieved during filtration. Whiskers show 1 standard deviation. Panel C shows the number of nucleated cells on the filter, with the CTC fraction also shown. The X-axis summarizes the major differences between the filters and applies to all panels.

