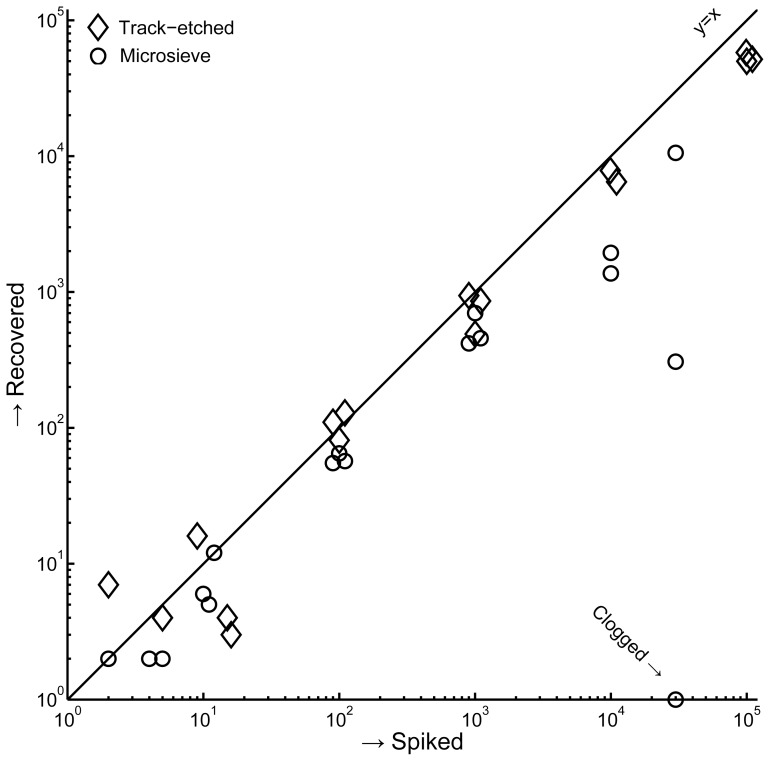
Figure 4. Linearity of recovery for 8 µm track-etched filters and 5 µm microsieves.
Whole blood was spiked with 2, 10, 100, 1000, 10000, 30000 (microsieve only) or 100,000 (track-etch only) MDA-231. For spikes with target values of 2 and 10 cells, we determined the actual number of cells by microscope inspection of the cell drop prior to spiking. The counted spikes are shown, not the targets. Spikes of 104 cells and higher were counted automatically. Spikes of 100 and higher were offset by up to 10% to enhance readability of the graph.

