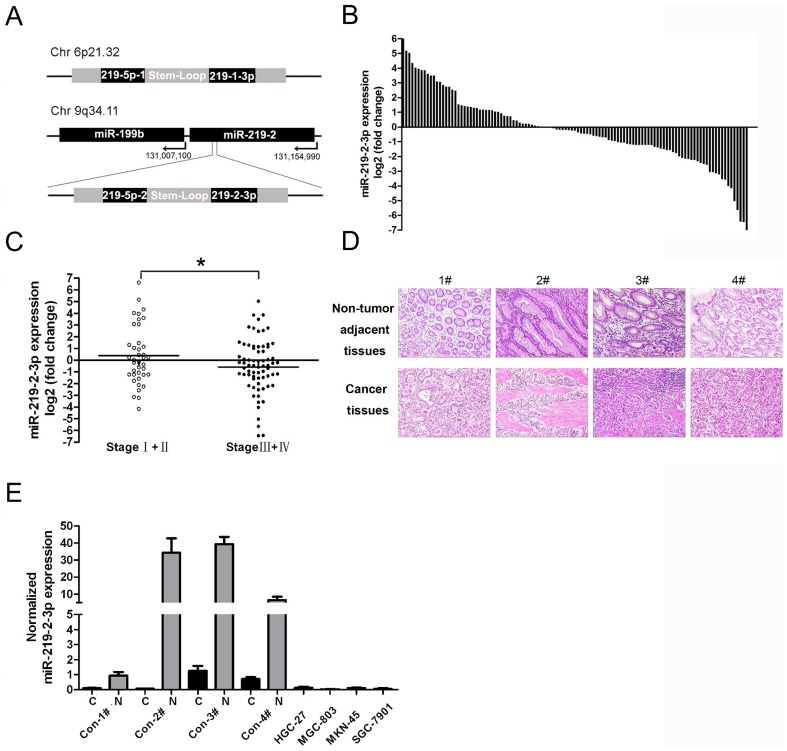
Figure 1. The expression of miR-219-2-3p in gastric cancer tissues and cell lines.
(A) Schematic showing human mir-219-1 and mir-219-2 genomic structures. Processing of the precursor transcripts generates the same miR-219-5p and two unique miRNAs, 219-1-3p and 219-2-3p. (B) MiR-219-2-3p was detected in 113 GC patients by real-time -PCR. Data is presented as log 2 of fold change of GC tissues relative to non-tumor adjacent tissues. (C) Expression levels (as log 2 of fold change of GC tissues relative to non-tumor adjacent tissues) of miR-219-2-3p in I–II stages (n = 39) versus III–IV stages (n = 71) of the cancer patients. (D) The four patients who were diagnosed as gastric cancer in H&E staining (original magnification, x100). (E) Expression levels of miR-219-2-3p were examined by real-time PCR in four patients as described in fig.1D and four GC cell lines. Experiments were performed three times. All data uses independent t test and is shown as mean ± SD. *, P<0.05.

