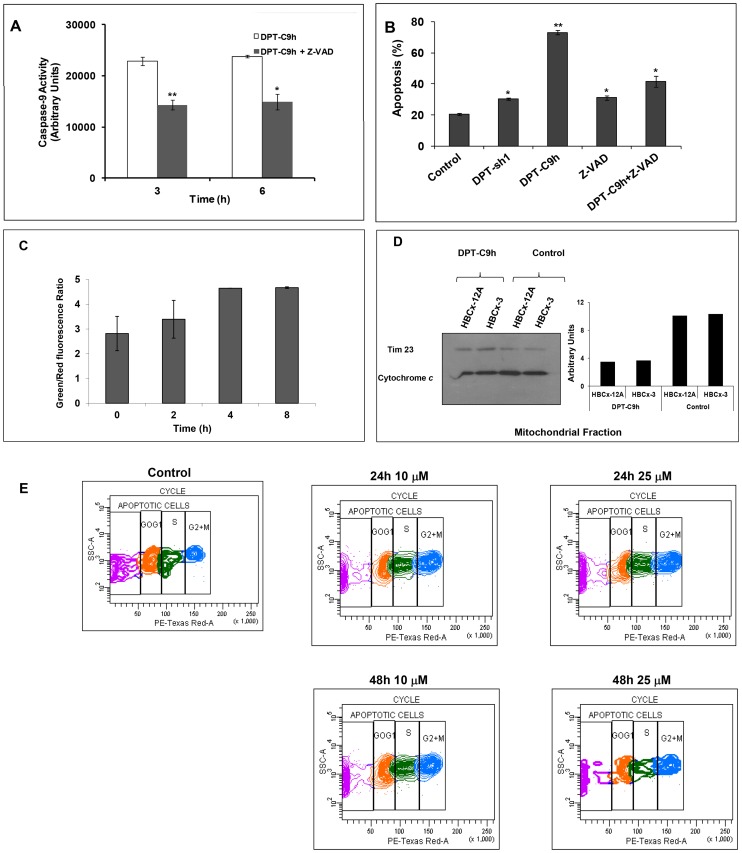
Figure 3. Effect of DPT-C9h on caspase-9 activation, mitochondrial membrane depolarization, cytochrome c release and cell cycle.
A) HBCx-3 cells were cultured for 3 or 6 h with medium (control), 100 µM of DPT-C9h or 10 µM of the caspase inhibitor Z-VAD (pre incubation of 1h) and 100 µM of DPT-C9h. Caspase-9 activity was estimated using a luminogenic substrate. Results are represented relative to control non-treated cells as arbitrary units. P values are shown. B) HBCx-3 cells were cultured for 24 h with medium (control), DPT-Sh1 (100 µM), DPT-C9h (100 µM) or Z-VAD (10 µM, pre incubation of 1h) and DPT-C9h (100 µM). Apoptosis was estimated by Annexin-V-FITC binding. C) HBCx-3 cells were treated for different periods of time with DPT-C9h (100 µM) and then incubated for 30 min at 37°C protected from the light with the fluorescent probe JC-10. Green and red fluorescence were measured. Data are represented relative to the control non-treated cells. P values are shown. D) HBCx-12A and HBCx-3 cell lines were treated for 24 h with 100 µM of DPT-C9 h. Mitochondrial fraction was separated from whole cell lysates and immunoblotted for cytochrome c. The WB was also hybridized with the mitochondrial marker Tim23 as internal control of protein loading. E) HBCx-3 cells were non-treated (control) or treated with 10 or 25 µM of DPT-C9h for 24 or 48 h and the cell cycle was analyzed by FACS.

