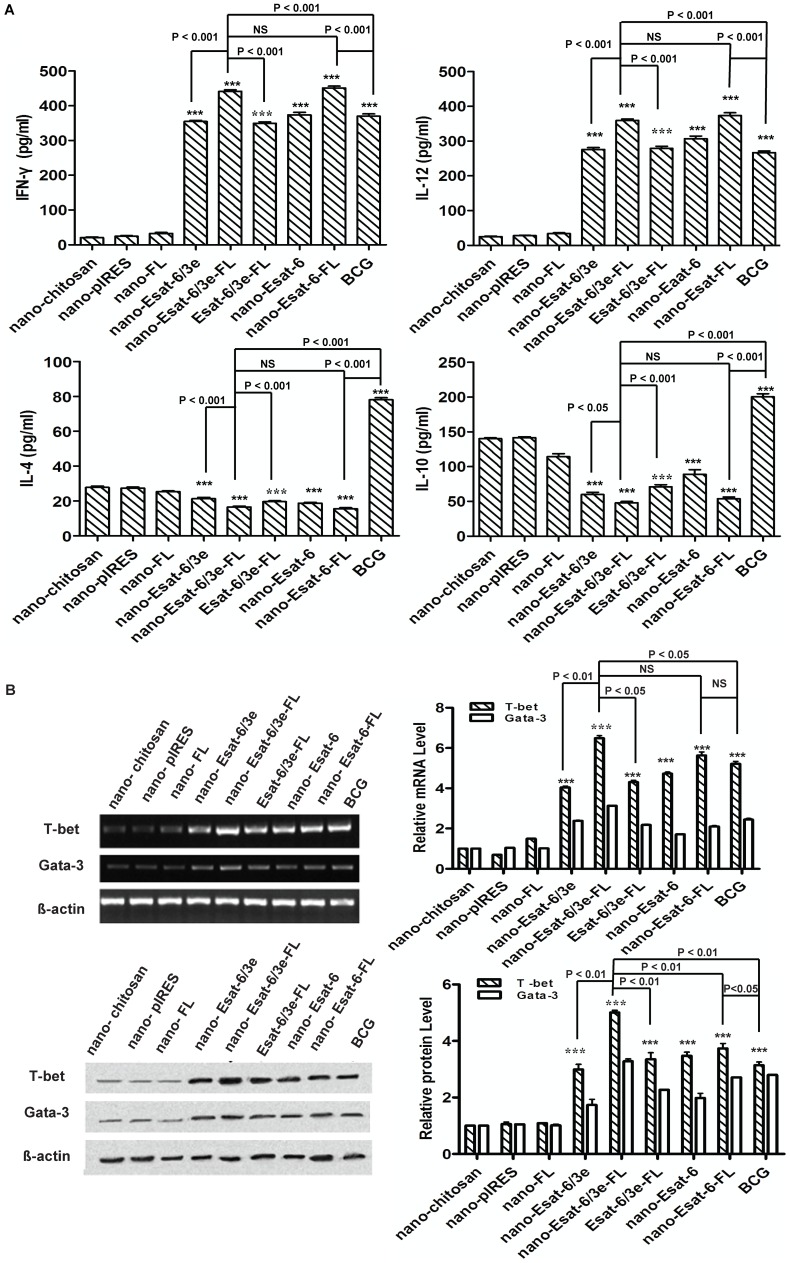
Figure 2. Splenocytes of the mice immunized with different plasmids were cultured and stimulated with Esat-6/3e (10 µg/ml) for 72 h, and the production of IFN-γ, IL-12, IL-4 and IL-10 in the splenocyte supernatants and expression of T-bet and Gata-3 in the splenocytes were measured by ELISA and Western blot, respectively.
A. The levels of Th1 type cytokines (IFN-γ and IL-12) and Th2 type cytokines (IL-4 and IL-10). B. The expression levels of T-bet or Gata-3 mRNA and protein. The representative graph and histograms in the immunized mice were showed. The experiments were performed in three times. All data are from one representative of three experiments, and presented as the mean value ± SD (n = 6). The statistics were performed with one-way ANOVA. NS: P>0.05; *P<0.05 and ***P<0.001 versus the mice with nano-chitosan, nano-pIRES and nano-FL immunization respectively. The other significant differences among the mice vaccinated with nano-Esat-6/3e-FL, nano-Esat-6/3e, Esat-6/3e-FL, nano-Esat-6, nano-Esat-6-FL and BCG were displayed on the figure directly.

