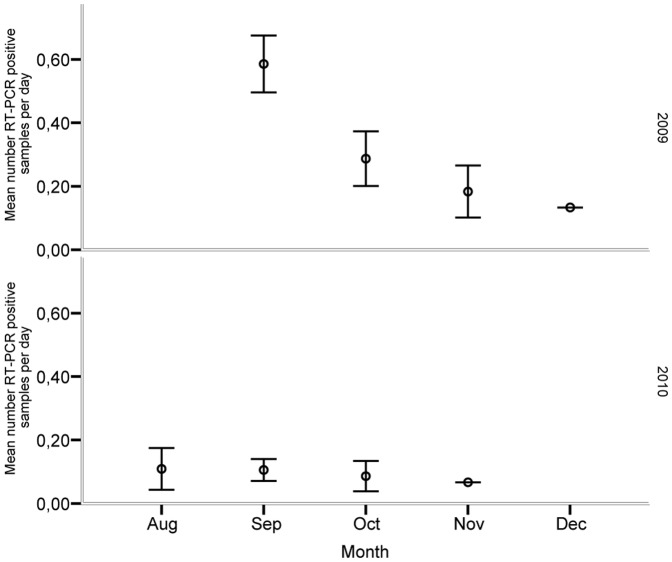
Figure 2. Mean number of influenza A virus (RRT-PCR) positive samples per day over the autumn months in 2009 and 2010 (corrected for sample effort).
Means and 95% confidence intervals are provided, based on samples taken every day of 10 mallards kept under close to natural conditions in close proximity to wild mallards.

