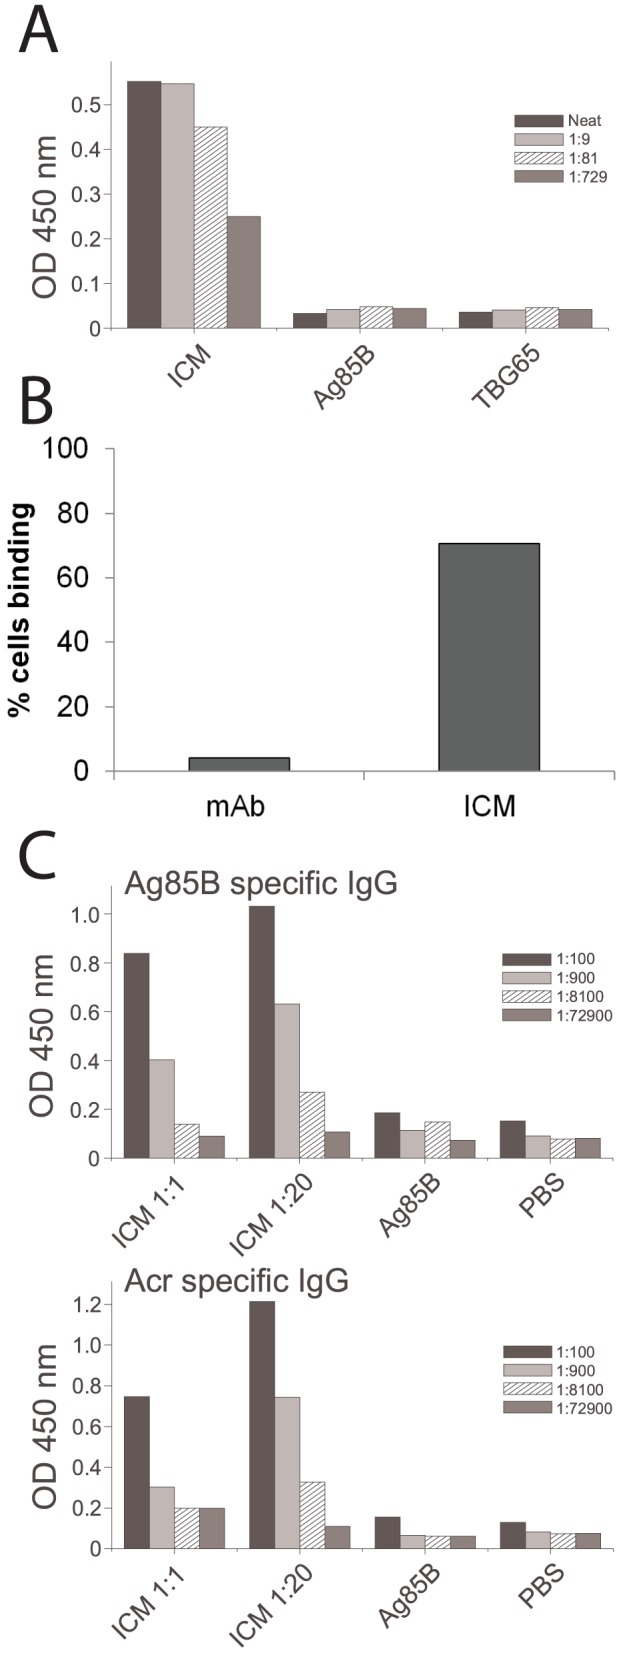
Figure 3. Functional evaluation of ICM in vitro and in vivo.

A) Complement C1q binding ELISA; ICM were used at the 1∶20 antibody-antigen ratio and the neat sample contained 5 µg/m total protein (ICM) or the equivalent amount for individual components; each bar represents mean value from triplicate assays and the patterns indicate serial dilutions. B) Analysis of binding of ICM to spleen-derived APCs by flow cytometry; shown are the proportions of cells (out of 10,000 counted) that bound either mAb alone or ICM. C) Serum anti-Ag85B IgG responses from mice immunised with an equimolar (1∶1) or a low (1∶20) antibody-antigen ratio, twice at the base of the tail, at 3-week intervals. Mice were culled 3 weeks after the final immunisation. Shown are the mean values and corresponding serial dilutions from a pilot experiment (n = 3 mice).
