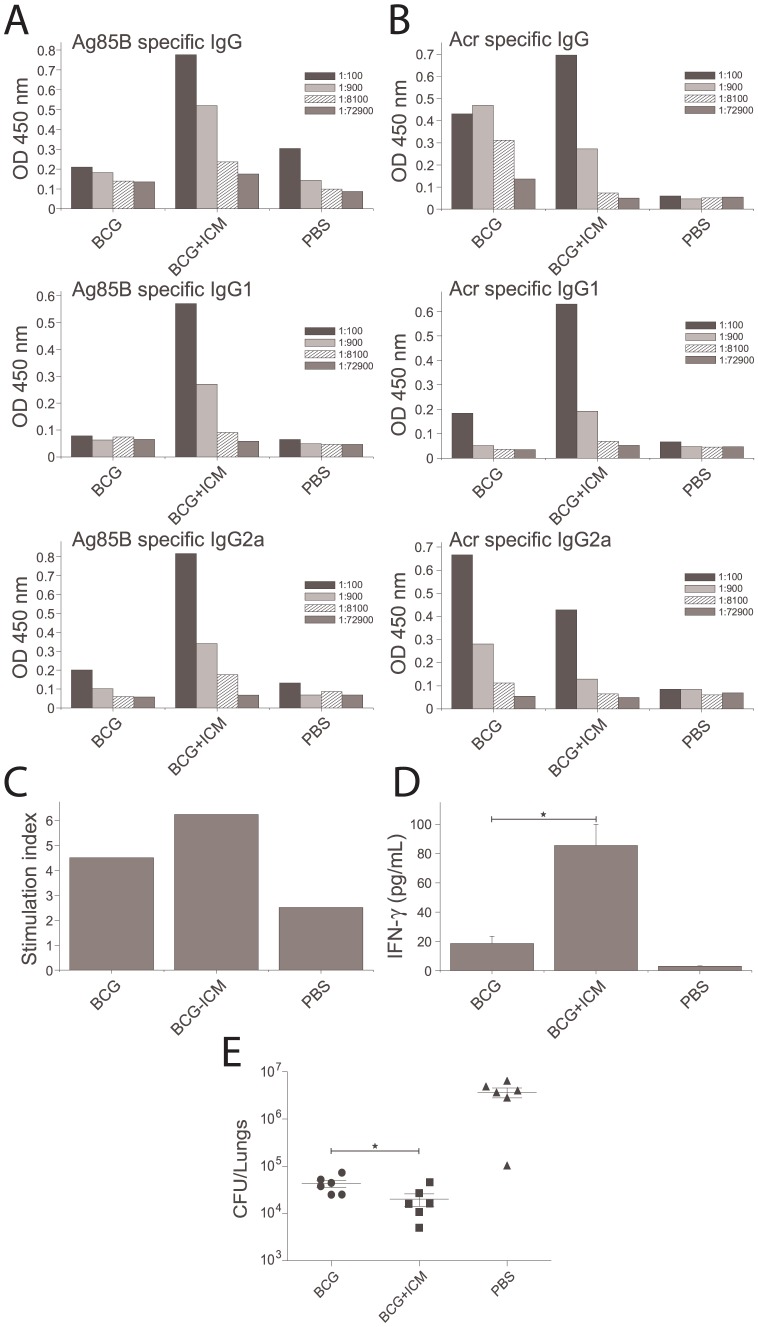
Figure 5. Immune responses and MTB bacterial counts in mice immunised with BCG and boosted with ICM.
Mice were immunised s.c. with BCG and twice boosted with ICM six and eight weeks later; 2 weeks after the final boost, mice were either culled and their tissues (blood and spleens) used for immunological evaluation, or challenged i.n. with 70,000 H37Rv. * Indicates statistically significant difference (p<0.05). A,B) Ag85B (A) and Acr (B) specific IgG, IgG1 and IgG2a serum responses determined by ELISA; shown are the mean values from 3 mice analysed in triplicates and in serial dilutions (indicated by differing patterns). C) Splenocyte proliferation after in vitro stimulation with Ag85B, measured by 3[H]-thymidine incorporation and expressed as stimulation indices (specific/nonspecific proliferation); n = 3 animals. D) IFN-γ release in splenocyte cultures (as in C) measured by an IFN-γ ELISA based kit. E) Lung bacterial counts in immunised mice; shown are the counts for individual mice (n = 6) and the means +/− SEM for each group.

