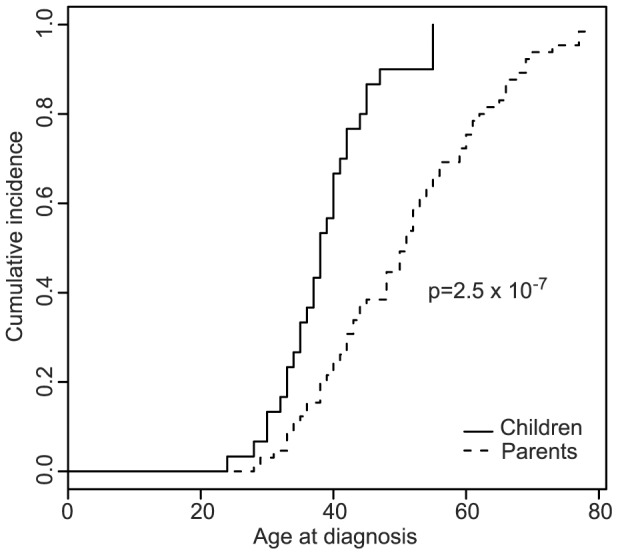
Figure 4. Anticipation in age of cancer onset in LS families.

Kaplan-Meier curves and associated p-values showing the differences in age of cancer onset between parents and children, all of them cancer-affected MMR gene mutation carriers.

Kaplan-Meier curves and associated p-values showing the differences in age of cancer onset between parents and children, all of them cancer-affected MMR gene mutation carriers.