
FIGURE 3.
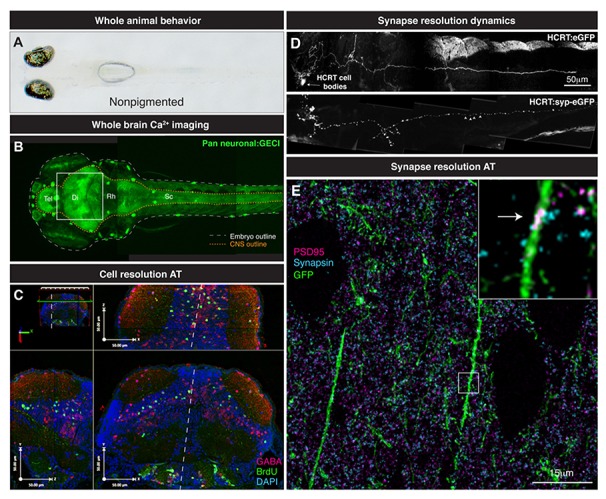
From whole brain to single synapse. (A) Behavioral processes can be studied in non-pigmented (Nacre; mitfa mutant) species of zebrafish. (B) Two-photon volume image of 5 dpf zebrafish expressing GCaMP pan-neuronally, note the linear organization of the brain along the rostrocaudal axis from telencephalon (tel) to spinal cord (sc). (C) Various maximal projections (from area indicated in B by white box) of the 5 dpf zebrafish midbrain reconstructed after array tomography against GABA (magenta), BrdU (green) and DAPI (cyan) markers. White dashed line depicts midline. (D) Genetically specified circuit analysis. Synaptophysin-eGFP (syp-eGFP) allows imaging of structural plasticity of synapses (white arrowheads) in hypocretin (HCRT) neurons. (E) Single synapse resolution projection of array tomography sections stained for GFP (green), PSD95 (magenta) and Synapsin (cyan). Inset, magnification of a single shaft synapse (white arrow).