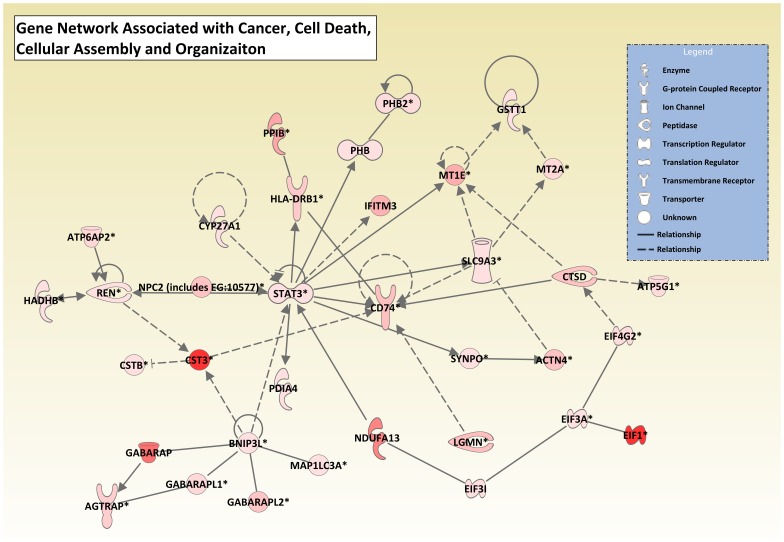
Figure 1. Graphical representation of oxidative phosphorylation and mitochondrial dysfunction pathways revealed significant genes in baboon kidney.
IPA was used to identify canonical pathways from the IPA library that were most significant in the baboon kidney RNA-Seq dataset. Molecules from the dataset that met a fold coverage cutoff of 302.8 and were associated with a canonical pathway in Ingenuity's knowledge Base were considered for the analysis. Oxidative phosphorylation and mitochondrial dysfunction were identified as the two most significant pathways in the dataset. Groups of molecules in the oxidative phosphorylation and mitochondrial dysfunction pathways are represented as various shades of red. The intensity of the node color indicates the degree of fold coverage in the RNA-Seq dataset. Nodes shown in gray represent genes from the dataset that did not meet the fold coverage cutoff, and nodes shown in white represent genes that are in IPA's Knowledge Base but not in the dataset. Members within each significant group of molecules are shown in Table S20.

