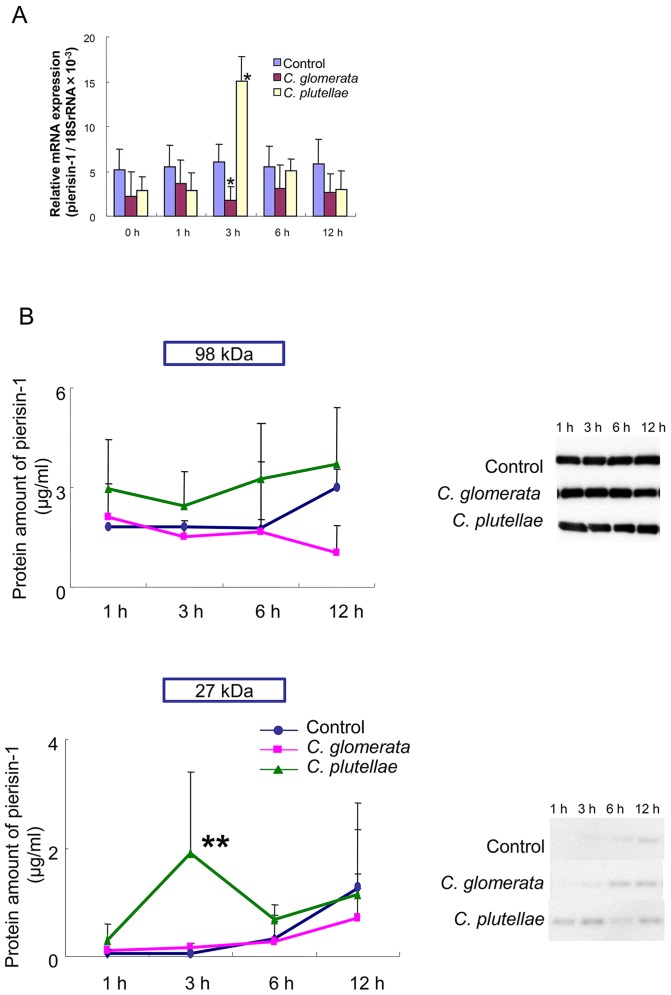
Figure 4. Alteration of pierisin-1 expression by parasitization.
A: mRNA levels were analyzed by real-time PCR after parasitization. Blue column, control: red column, C. glomerata; yellow column, C. plutellae. The numbers of mRNA molecules per one thousand 18 S ribosomal RNA were calculated. Values are the means ± S.Ds. of three analyses. The numbers of samples were five each at each time point. * p<0.001, when compared to control. B: Western blotting analysis of pierisin-1 protein in the hemolymph 1–12 h after parasitization by C. glomerata or C. plutellae. Amounts of full-length pierisin-1 (98-kDa) and 27-kDa N-terminal fragments of pierisin-1 were separately calculated using an imaging system, as mentioned in Materials and Methods. Circles control: squares, C. glomerata; triangles, C. plutellae. The numbers of samples were five each at each time point.▪ p<0.001, when compared to controls.

