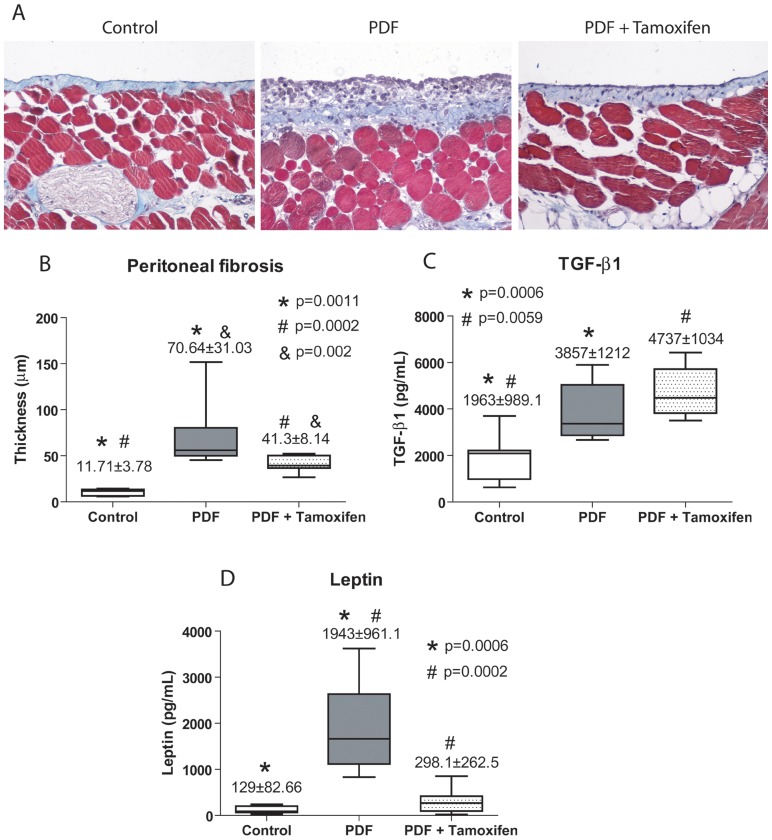
Figure 8. Administration of Tamoxifen decreases PD-induced peritoneal membrane thickness in a mouse model.
Mice received a daily instillation of standard PD fluid for 4 weeks with or without the oral administration of Tamoxifen (1.5 mg/kg/day: PDF, n = 14 and PDF + Tamoxifen, n = 17). A control group of mice that were instilled with saline was also included (Control; n = 9). Peritoneal samples were prepared and analyzed as described in the Concise Methods. (A) Standard PD fluid exposure increases matrix deposition and the thickness of the peritoneal membrane, while Tamoxifen administration significantly reduces these effects when measured in Masson's trichrome stained sections (representative slides). Magnification ×200. (B) The peritoneal thickness ( µm) is increased in DPF group compared with control mice, and the group PDF with Tamoxifen shows a significant reduction of thickness when compared with PDF group. Analysis of variance results in a significance of p<0.0001 (ANOVA). Box Plots graphic represent 25th and 75th percentiles, median, minimum and maximum values of thickness ( µm). (C) Measurement of TGF-β1 in the drained volumes shows an increase of this growth factor in PD fluid-instilled animals and administration of Tamoxifen does not reduce TGF-β1 production. The statistical analysis of variance gives a significance of p = 0.0003. (D) Measurement of leptin in the drained volumes demonstrates an increase of this adipocytokine in PD fluid-instilled animals and administration of Tamoxifen significantly reduces leptin production, p<0.0001 (ANOVA). Box plots are depicted as picograms per millilitre (pg/mL) and represent the median, minimum and maximum values, as well as the 25th and 75th percentiles. Numbers above boxes depict means ± SE. Symbols represent the statistical differences between groups.

