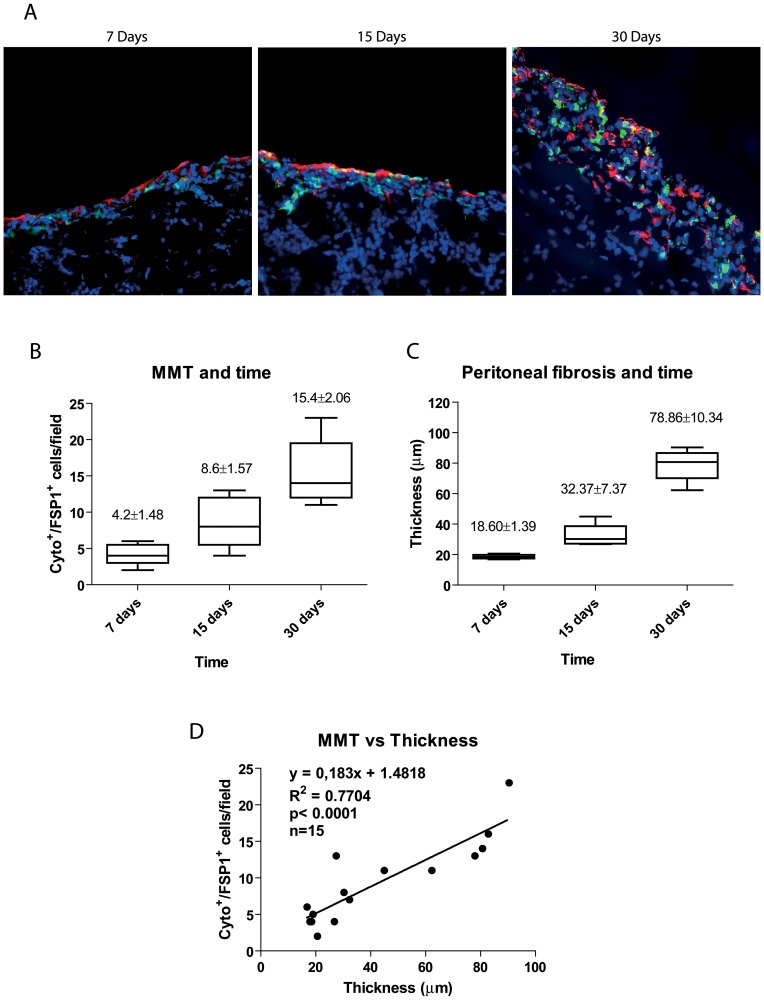
Figure 10. Parallelism between MMT, PM thickness and time on PD.
(A) Immunofluorescence microscopy images of parietal peritoneal sections stained for cytokeratin (green) and FSP-1 (red), with DAPI counterstaining, show accumulation of trans-differentiated mesothelial cells in the submesothelial space at 7, 15 and 30 days of PD mice. Progressive time-dependent increases of MMT and PM thickness is observed during PD fluid exposure. Representative slides are presented. Magnification ×200. (B) Quantification of the submesothelial MMT (cytokeratin/FSP-1 double positive cells per field) at different time points. (C) Quantification of peritoneal thickness ( µm) at different time points. Box Plots represent 25% and 75% percentiles, median, minimum and maximum values. Numbers above boxes depict means ± SE. Symbols show statistical differences between groups. (D) Correlation between both MMT and peritoneal thickness was determined by Spearman regression analysis.

