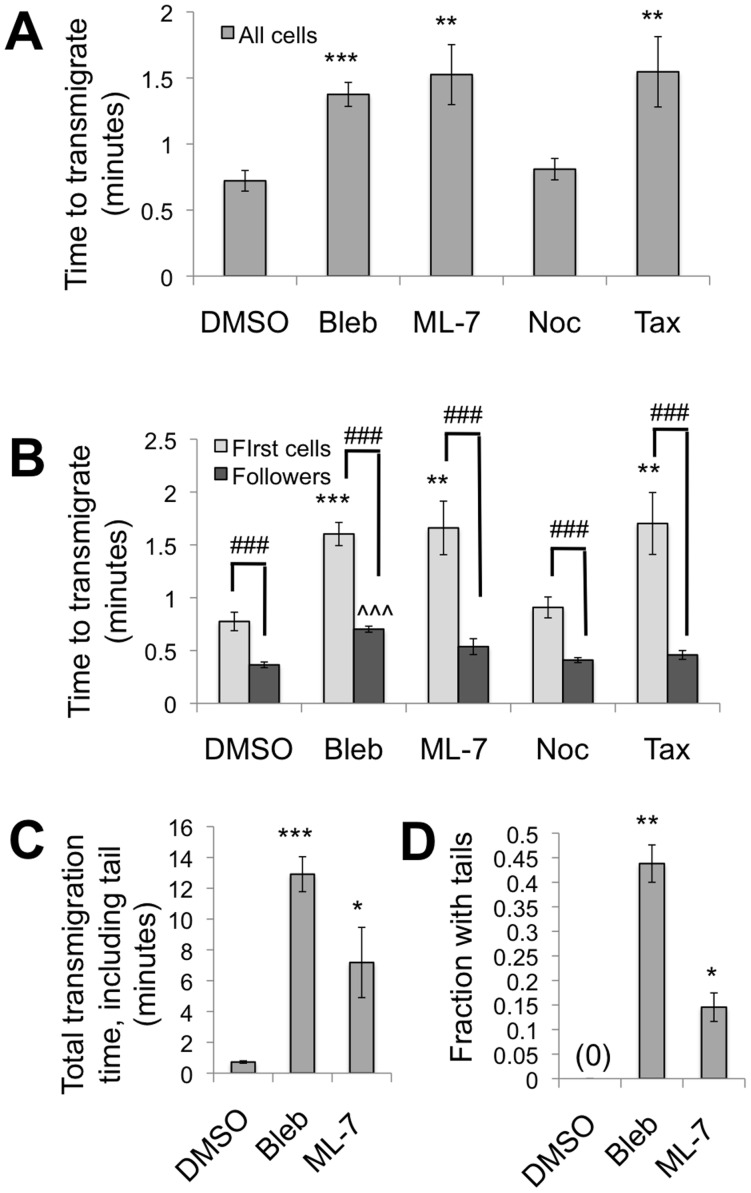
Figure 5. Time to complete transmigration.
(A) Transmigration time (through endothelium on 5 kPa gel) for all neutrophils, from when the first protrusion is seen under the endothelium, to complete transmigration (except tails for the cases of blebbistain and ML-7), for all treatments. Bars represent mean ± SEM of pooled data from 3 independent experiments (N = 61, 103, 75, 182, 32 for DMSO, blebbistatin, ML-7, nocodazole, and taxol, respectively). ** indicates P<0.01 and *** indicates P<0.001 with DMSO vehicle control, using a t-test. (B) Transmigration times are shown separately for the “first cells” that enter the endothelium, as well as the “followers” that used the same gap to transmigrate as one of the first cells. Bars represent mean ± SEM of pooled data from 3 independent experiments (For first cells, N = 53, 77, 66, 146, 28, while for followers N = 8, 26, 9, 36, 4 for DMSO, blebbistatin, ML-7, nocodazole, and taxol, respectively). ** indicates P<0.01 and *** indicates P<0.001 with DMSO vehicle control for first cells, while ∧∧∧ indicates P<0.001 with DMSO vehicle control for followers, using a t-test. ### indicates P<0.001 between first cells and followers using a t-test. (C) Total transmigration time, including the time for the final tail to disappear beneath the endothelium. Bars represent mean ± SEM of pooled data from 3 independent experiments (N = 61,68,12 for DMSO, blebbistatin and ML-7, respectively). * and *** indicate P<0.05 or P<0.001 with the DMSO control, using a t-test. (D) Fraction of neutrophils with tails that remain above the endothelium for a prolonged length of time after transmigration of the majority of the neutrophil. Bars represent mean ± SEM of 3–4 independent experiments. * and ** indicate P<0.05 or P<0.01 with the DMSO control, using a t-test.

