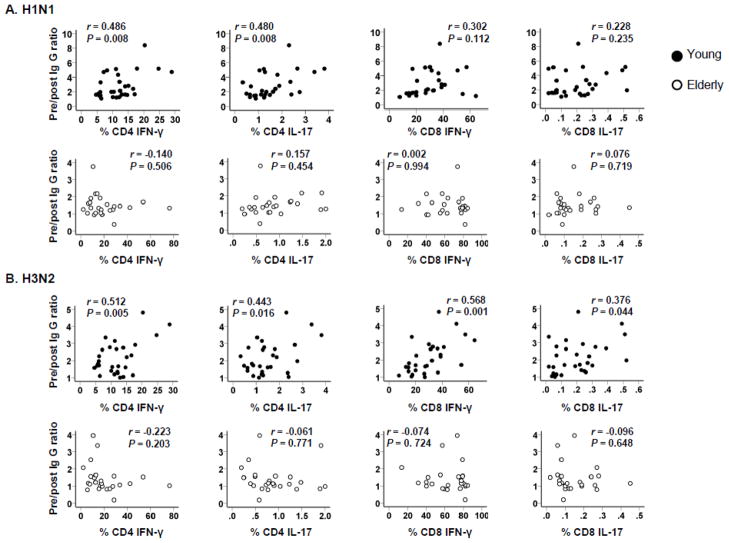
Figure 4. Correlation of CD4+ and CD8+ T cells producing IFN-γ and IL-17 with IgG responses to influenza vaccine in young and elderly people.
PBMCs were obtained from healthy young (n = 29) and elderly (n = 26) people before influenza vaccination. Cells were stimulated 4 hours with PMA/ionomycin or control (PBS) followed by flow cytometric analysis for CD4+ and CD8+ T cells producing IFN-γ and IL-17 as shown in Figure 3. Serum levels of IgG specific for influenza virus (A/California/7/2009 (H1N1) and A/Perth/16/2009 (H3N2)) in pre- and post-vaccination sera were determined by ELISA as described in Figure 1. Ratios of pre- and post-vaccination IgG levels were calculated and correlated with the frequency of CD4+ and CD8+ T cells producing cytokines. P values were determined by Pearson correlation analysis.

