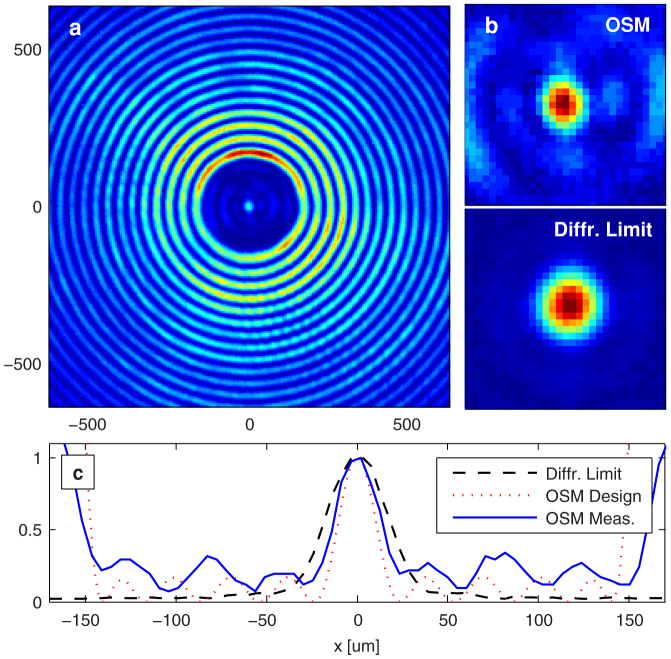
Figure 2. A comparison of measured PSFs for the OSM and the diffraction-limited system.
(a) An image of a 10 μm hole obtained by the OSM, which approximates the system's PSF. (b) A close up of the focal point (top), which clearly shows a reduced size compared to the diffraction-limited focal point (bottom). (c) A horizontal cross-section plot of the detected intensity across the center of the superoscillatory image waveform, showing reasonable agreement with the theoretical PSF, and clear spot-size reduction from the diffraction-limited focus.

