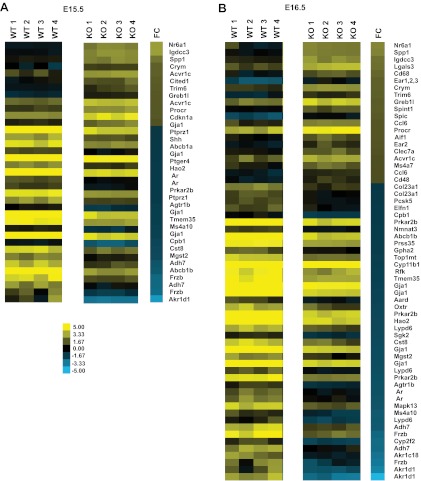
Figure 4.
Gene expression differences between adrenals from control and Sf1-Cre/Dicerlox/lox embryos at E15.5 and E16.5. Heatmaps generated from Affymetrix gene expression arrays illustrate differentially expressed genes in adrenals from Dicer-KO and control (WT, cre− littermates) embryos at E15.5 (A) and E16.5 (B). Data were filtered by excluding probe sets with an FDR of ≥.05 and a log2-fold change of ≤1.5 or ≥−1.5. Yellow bars indicate an increase over the mean chip intensity, and blue indicates a decrease over mean intensity. FC represents log2-fold change between the 4 Dicer-KO litters/replicates compared with the 4 WT litters/replicates.

