
Figure 5.
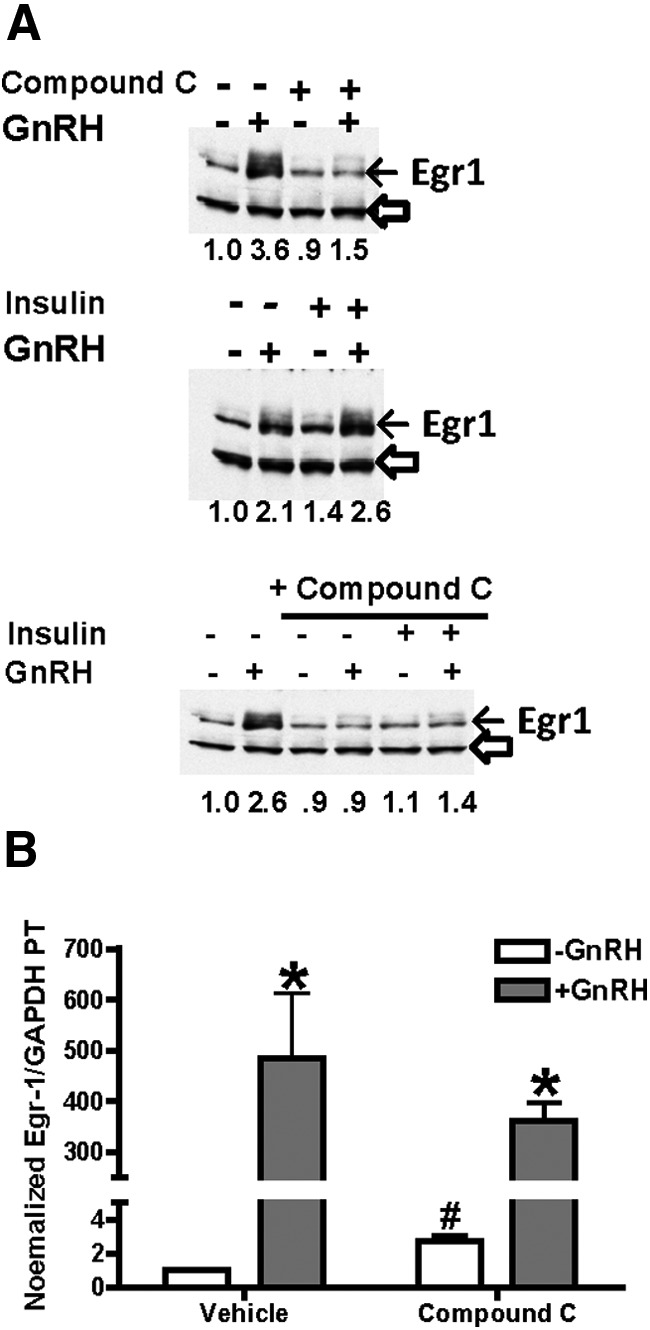
GnRH-stimulated Egr-1 protein levels are inhibited by compound C. A, LβT2 cells were treated with 20nM insulin for 1 hour and then with 100nM GnRH for 30 minutes. Some cells were also pretreated with 40μM compound C for 30 minutes before GnRH. After treatment, cells were collected for protein and RNA measurement. Protein lysates (20 μg) were analyzed on SDS-PAGE gels and immunoblots with antibodies against Egr-1 and β-actin on the same blot. The migration of Egr-1 is shown by the closed arrow and the loading control by the open arrowhead on each blot. Calculated normalized Egr-1 levels are shown under each lane relative to untreated control expressed as 1.0. B, In some cells, Egr-1 mRNA primary transcript was measured by RT-PCR and normalized for GAPDH mRNA in the same samples. Values are expressed as the mean ± SEM for 3 experiments. *P < .05, treatment vs GnRH; #P < .05, vehicle vs compound C.