
Figure 3.
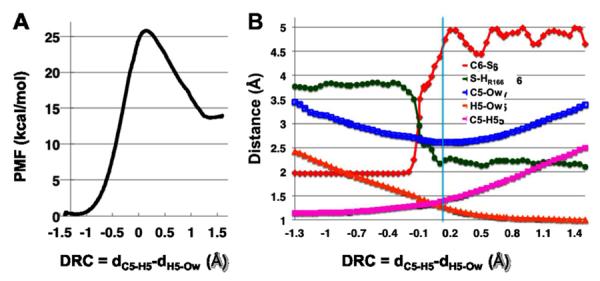
The AM1/MM PMF calculation at 25 °C provided (A) the free energy profile for the deprotonation of C5 (step III.1 in Scheme 3), and (B) changes in interatomic distances along the DRC. Atom labels: C5, H5, and C6 refer to the atoms on dUMP; S--the S atom of C146; HR166--the H atom of R166 that is closest to S (see the structures in Figure 4); Ow--the O atom of wat47. The cyan line indicates the average value of the DRC at the TS.